
- Startseite >
- Flüsse >
- Wasserstand >
- Iller - Lech - Bodensee >
- Egelsee >
- Jahresgrafik

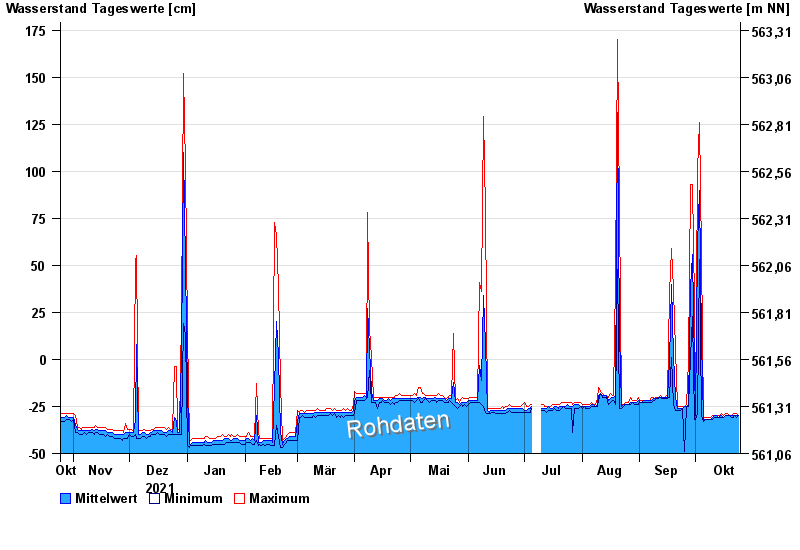
Jahresgrafik Egelsee / Iller
Wasserstand vom 25.10.2021 bis zum 24.10.2022
Baustelle
Störung der Messwerterfassung
- 02.06.2013 Wasserstand: 338 cm
- 06.08.2010 Wasserstand: 265 cm
- 03.06.2010 Wasserstand: 244 cm
- 11.06.2013 Wasserstand: 238 cm
- 13.01.2011 Wasserstand: 232 cm
| Datum | Mittelwert [cm] | Maximum [cm] | Minimum [cm] |
|---|---|---|---|
| 24.10.2022 | -30 | -30 | -30 |
| 23.10.2022 | -30 | -29 | -31 |
| 22.10.2022 | -30 | -29 | -30 |
| 21.10.2022 | -30 | -29 | -31 |
| 20.10.2022 | -30 | -30 | -31 |
| 19.10.2022 | -30 | -30 | -30 |
| 18.10.2022 | -30 | -29 | -30 |
© Bayerisches Landesamt für Umwelt 2024