
- Startseite >
- Flüsse >
- Wasserstand >
- Iller - Lech - Bodensee >
- Egelsee >
- Jahresgrafik

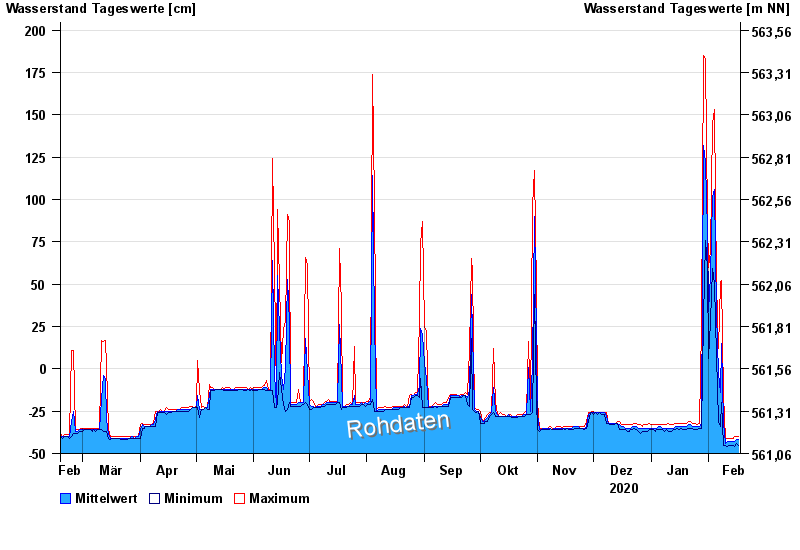
Jahresgrafik Egelsee / Iller
Wasserstand vom 18.02.2020 bis zum 17.02.2021
Baustelle
Störung der Messwerterfassung
- 02.06.2013 Wasserstand: 338 cm
- 06.08.2010 Wasserstand: 265 cm
- 03.06.2010 Wasserstand: 244 cm
- 11.06.2013 Wasserstand: 238 cm
- 13.01.2011 Wasserstand: 232 cm
| Datum | Mittelwert [cm] | Maximum [cm] | Minimum [cm] |
|---|---|---|---|
| 17.02.2021 | -42 | -40 | -45 |
| 16.02.2021 | -42 | -40 | -44 |
| 15.02.2021 | -43 | -40 | -46 |
| 14.02.2021 | -43 | -41 | -45 |
| 13.02.2021 | -43 | -41 | -45 |
| 12.02.2021 | -43 | -41 | -45 |
| 11.02.2021 | -43 | -41 | -46 |
© Bayerisches Landesamt für Umwelt 2024