
- Startseite >
- Flüsse >
- Wasserstand >
- Iller - Lech - Bodensee >
- Biessenhofen >
- Jahresgrafik

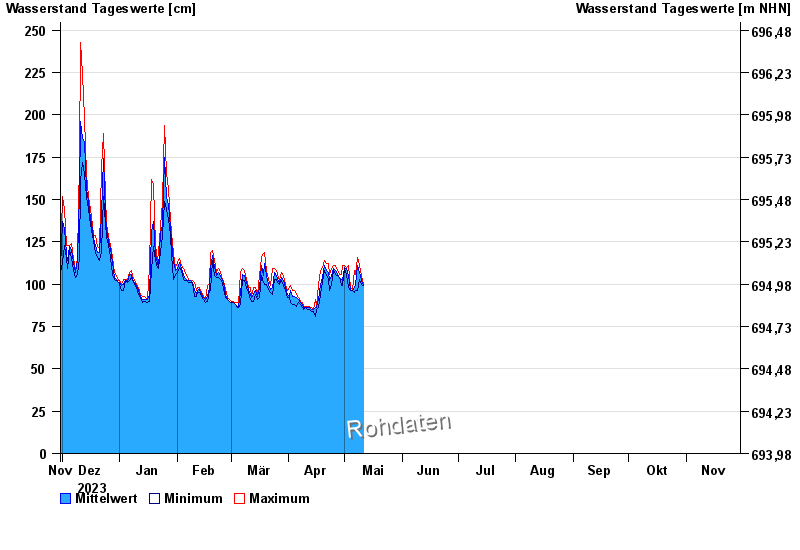
Jahresgrafik Biessenhofen / Wertach
Wasserstand vom 30.11.2023 bis zum 29.11.2024
| Datum | Mittelwert [cm] | Maximum [cm] | Minimum [cm] |
|---|---|---|---|
| 20.05.2024 | 97 | 101 | 94 |
| 19.05.2024 | 100 | 107 | 93 |
| 18.05.2024 | 95 | 99 | 90 |
| 17.05.2024 | 101 | 105 | 92 |
| 16.05.2024 | 94 | 96 | 90 |
| 15.05.2024 | 96 | 96 | 96 |
| 14.05.2024 | 97 | 97 | 96 |
© Bayerisches Landesamt für Umwelt 2024