
- Startseite >
- Flüsse >
- Wasserstand >
- Iller - Lech - Bodensee >
- Biessenhofen >
- Jahresgrafik

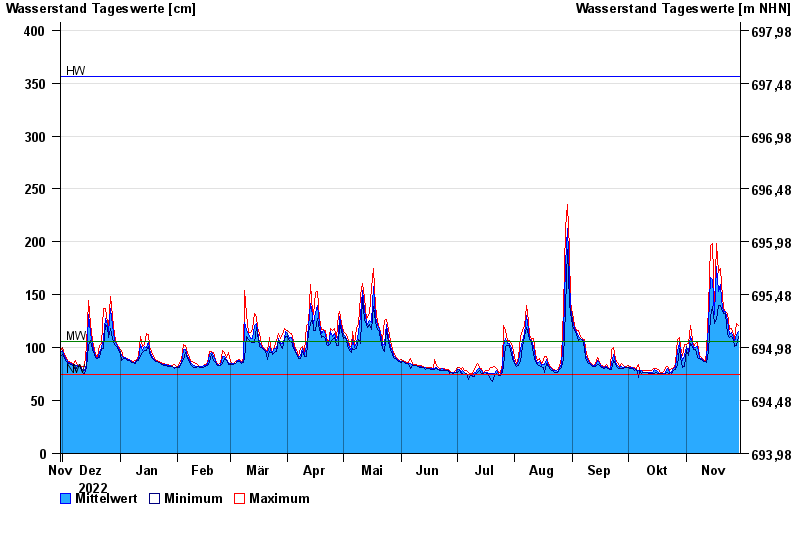
Jahresgrafik Biessenhofen / Wertach
Wasserstand vom 30.11.2022 bis zum 29.11.2023
| Datum | Mittelwert [cm] | Maximum [cm] | Minimum [cm] |
|---|---|---|---|
| 29.11.2023 | 115 | 121 | 111 |
| 28.11.2023 | 112 | 123 | 102 |
| 27.11.2023 | 106 | 109 | 101 |
| 26.11.2023 | 110 | 112 | 108 |
| 25.11.2023 | 114 | 118 | 111 |
| 24.11.2023 | 112 | 117 | 110 |
| 23.11.2023 | 126 | 132 | 112 |
© Bayerisches Landesamt für Umwelt 2024