
- Startseite >
- Flüsse >
- Wasserstand >
- Oberer Main - Elbe >
- Untersteinach >
- Jahresgrafik

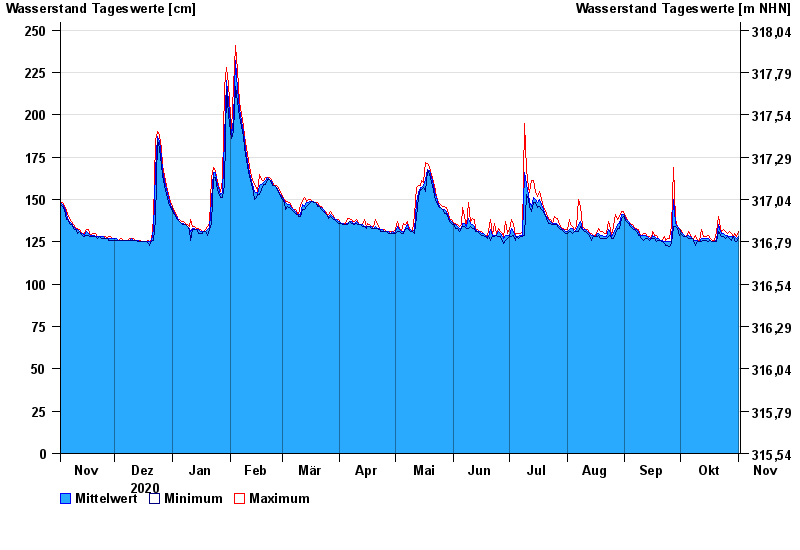
Jahresgrafik Untersteinach / Untere Steinach
Wasserstand vom 02.11.2020 bis zum 01.11.2021
| Datum | Mittelwert [cm] | Maximum [cm] | Minimum [cm] |
|---|---|---|---|
| 01.11.2021 | 128 | 131 | 127 |
| 31.10.2021 | 127 | 128 | 125 |
| 30.10.2021 | 128 | 130 | 126 |
| 29.10.2021 | 128 | 128 | 128 |
| 28.10.2021 | 128 | 130 | 126 |
| 27.10.2021 | 128 | 131 | 127 |
| 26.10.2021 | 129 | 130 | 128 |
© Bayerisches Landesamt für Umwelt 2024