
- Startseite >
- Flüsse >
- Wasserstand >
- Oberer Main - Elbe >
- Untersteinach >
- Jahresgrafik

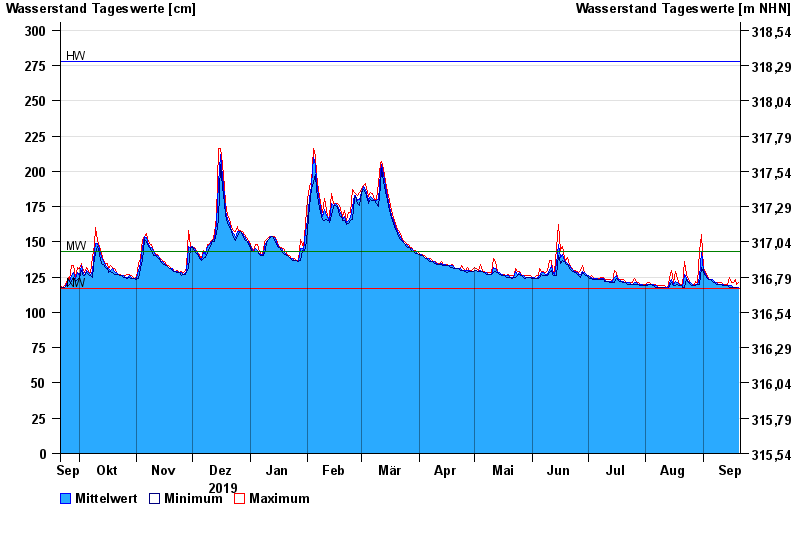
Jahresgrafik Untersteinach / Untere Steinach
Wasserstand vom 21.09.2019 bis zum 20.09.2020
| Datum | Mittelwert [cm] | Maximum [cm] | Minimum [cm] |
|---|---|---|---|
| 20.09.2020 | 118 | 121 | 117 |
| 19.09.2020 | 118 | 120 | 118 |
| 18.09.2020 | 118 | 123 | 118 |
| 17.09.2020 | 118 | 121 | 118 |
| 16.09.2020 | 119 | 121 | 118 |
| 15.09.2020 | 119 | 125 | 118 |
| 14.09.2020 | 119 | 120 | 119 |
© Bayerisches Landesamt für Umwelt 2024