
- Startseite >
- Flüsse >
- Wasserstand >
- Oberer Main - Elbe >
- Steinberg >
- Jahresgrafik

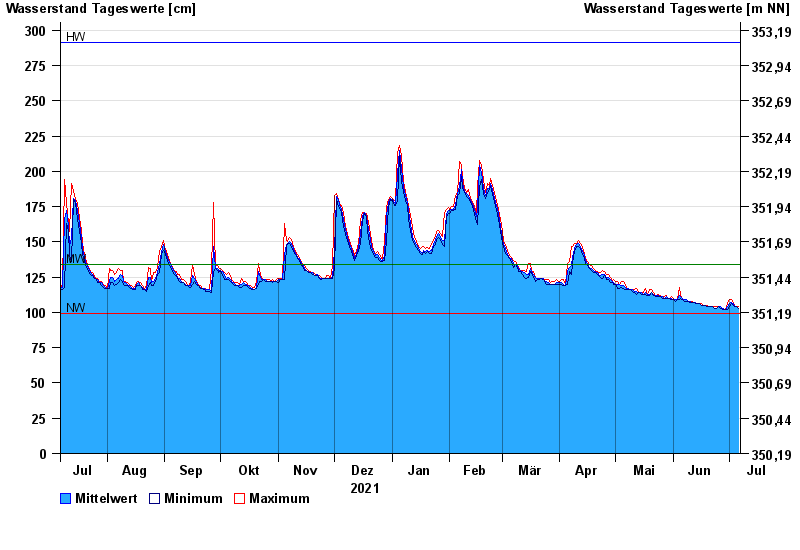
Jahresgrafik Steinberg / Kronach
Wasserstand vom 07.07.2021 bis zum 06.07.2022
| Datum | Mittelwert [cm] | Maximum [cm] | Minimum [cm] |
|---|---|---|---|
| 06.07.2022 | 103 | 104 | 103 |
| 05.07.2022 | 104 | 104 | 104 |
| 04.07.2022 | 104 | 105 | 104 |
| 03.07.2022 | 106 | 106 | 105 |
| 02.07.2022 | 107 | 109 | 106 |
| 01.07.2022 | 106 | 109 | 104 |
| 30.06.2022 | 104 | 106 | 102 |
© Bayerisches Landesamt für Umwelt 2024