
- Startseite >
- Flüsse >
- Wasserstand >
- Oberer Main - Elbe >
- Schlehenmühle >
- Jahresgrafik

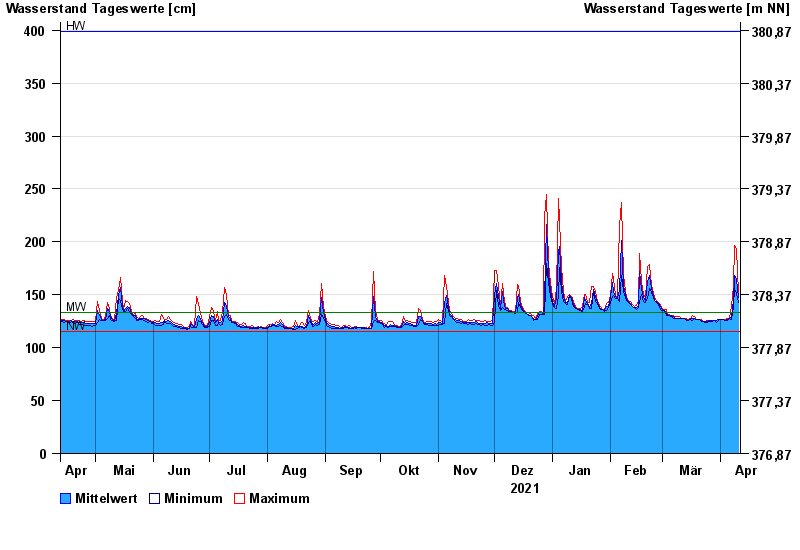
Jahresgrafik Schlehenmühle / Roter Main
Wasserstand vom 12.04.2021 bis zum 11.04.2022
| Datum | Mittelwert [cm] | Maximum [cm] | Minimum [cm] |
|---|---|---|---|
| 11.04.2022 | 147 | 151 | 143 |
| 10.04.2022 | 164 | 194 | 151 |
| 09.04.2022 | 168 | 197 | 156 |
| 08.04.2022 | 145 | 159 | 139 |
| 07.04.2022 | 129 | 139 | 127 |
| 06.04.2022 | 128 | 128 | 128 |
| 05.04.2022 | 127 | 128 | 126 |
© Bayerisches Landesamt für Umwelt 2024