
- Startseite >
- Flüsse >
- Wasserstand >
- Oberer Main - Elbe >
- Pfarrweisach >
- Jahresgrafik

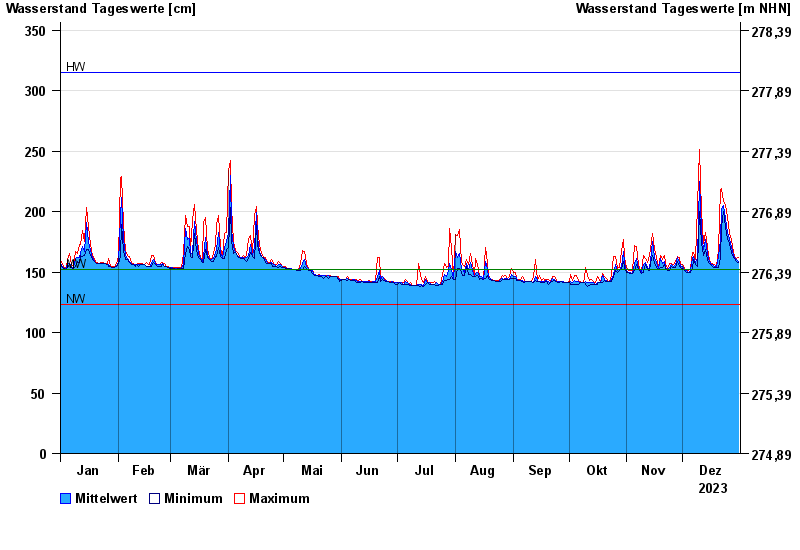
Jahresgrafik Pfarrweisach / Weisach
Wasserstand vom 01.01.2023 bis zum 31.12.2023
| Datum | Mittelwert [cm] | Maximum [cm] | Minimum [cm] |
|---|---|---|---|
| 31.12.2023 | 159 | 162 | 158 |
| 30.12.2023 | 160 | 161 | 159 |
| 29.12.2023 | 162 | 163 | 161 |
| 28.12.2023 | 164 | 166 | 162 |
| 27.12.2023 | 170 | 177 | 166 |
| 26.12.2023 | 178 | 182 | 174 |
| 25.12.2023 | 183 | 195 | 177 |
© Bayerisches Landesamt für Umwelt 2025