
- Startseite >
- Flüsse >
- Wasserstand >
- Oberer Main - Elbe >
- Pfarrweisach >
- Jahresgrafik

Jahresgrafik Pfarrweisach / Weisach
Wasserstand vom 28.09.2021 bis zum 27.09.2022
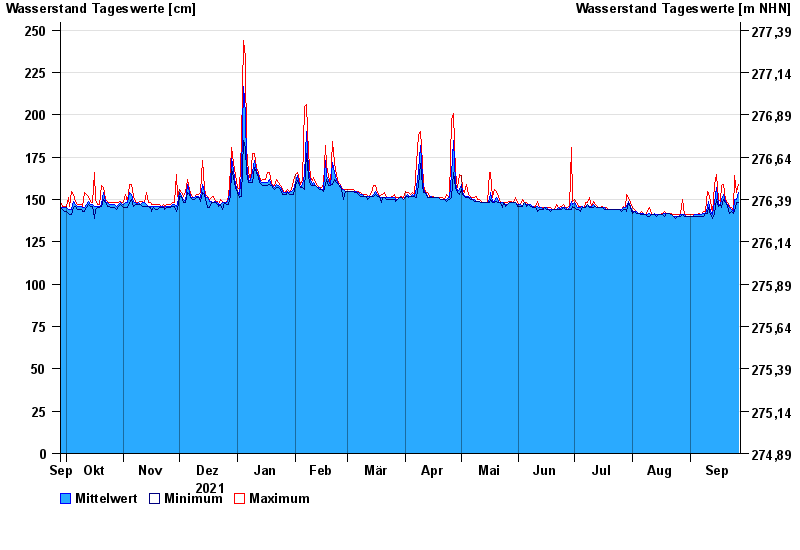
| Datum | Mittelwert [cm] | Maximum [cm] | Minimum [cm] |
|---|---|---|---|
| 27.09.2022 | 154 | 159 | 148 |
| 26.09.2022 | 150 | 154 | 148 |
| 25.09.2022 | 150 | 164 | 143 |
| 24.09.2022 | 143 | 143 | 142 |
| 23.09.2022 | 144 | 145 | 143 |
| 22.09.2022 | 145 | 146 | 142 |
| 21.09.2022 | 147 | 148 | 146 |
© Bayerisches Landesamt für Umwelt 2024