
- Startseite >
- Flüsse >
- Wasserstand >
- Oberer Main - Elbe >
- Pfarrweisach >
- Jahresgrafik

Jahresgrafik Pfarrweisach / Weisach
Wasserstand vom 18.09.2022 bis zum 17.09.2023
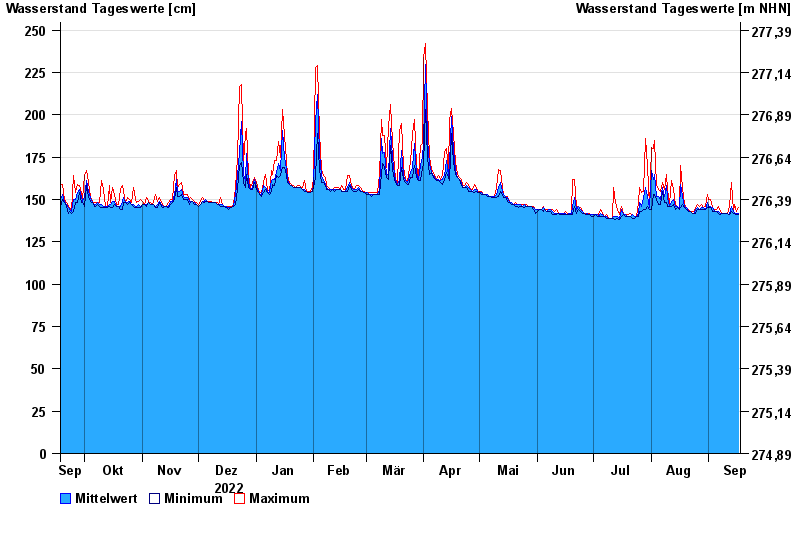
| Datum | Mittelwert [cm] | Maximum [cm] | Minimum [cm] |
|---|---|---|---|
| 17.09.2023 | 142 | 145 | 141 |
| 16.09.2023 | 142 | 143 | 141 |
| 15.09.2023 | 142 | 147 | 142 |
| 14.09.2023 | 143 | 143 | 142 |
| 13.09.2023 | 146 | 160 | 143 |
| 12.09.2023 | 141 | 146 | 141 |
| 11.09.2023 | 142 | 142 | 142 |
© Bayerisches Landesamt für Umwelt 2024