
- Startseite >
- Flüsse >
- Wasserstand >
- Oberer Main - Elbe >
- Oberhammer >
- Jahresgrafik

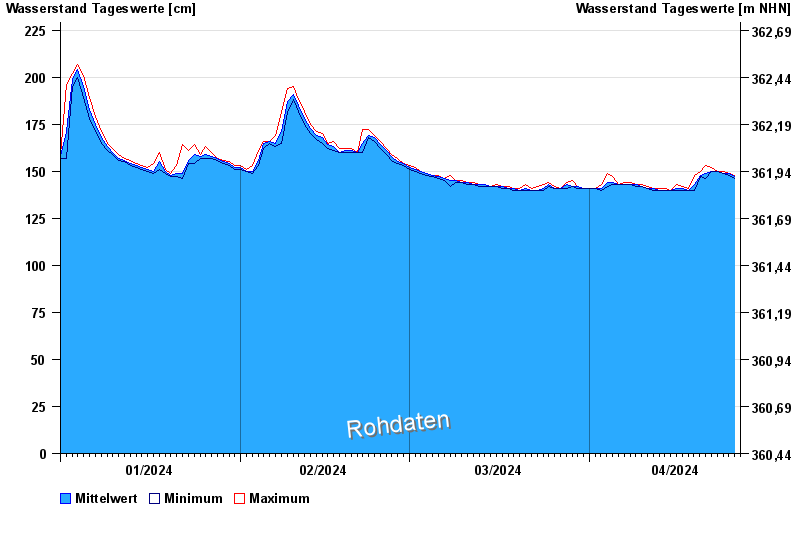
Jahresgrafik Oberhammer / Untere Steinach
Wasserstand vom 01.01.2024 bis zum 26.04.2024
| Datum | Mittelwert [cm] | Maximum [cm] | Minimum [cm] |
|---|---|---|---|
| 26.04.2024 | 147 | 148 | 146 |
| 25.04.2024 | 149 | 149 | 148 |
| 24.04.2024 | 149 | 150 | 149 |
| 23.04.2024 | 150 | 150 | 150 |
| 22.04.2024 | 150 | 152 | 150 |
| 21.04.2024 | 149 | 153 | 146 |
| 20.04.2024 | 148 | 150 | 147 |
© Bayerisches Landesamt für Umwelt 2024