
- Startseite >
- Flüsse >
- Wasserstand >
- Oberer Main - Elbe >
- Neukenroth >
- Jahresgrafik

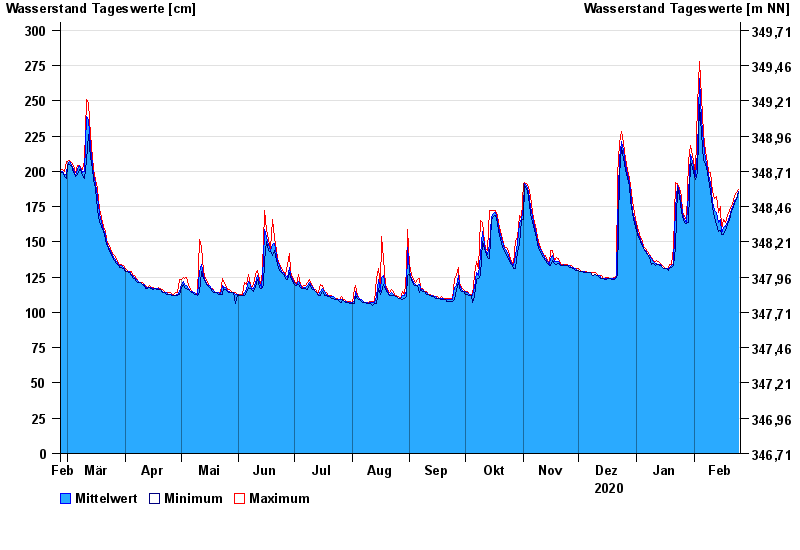
Jahresgrafik Neukenroth / Haßlach
Wasserstand vom 26.02.2020 bis zum 25.02.2021
| Datum | Mittelwert [cm] | Maximum [cm] | Minimum [cm] |
|---|---|---|---|
| 25.02.2021 | 186 | 187 | 185 |
| 24.02.2021 | 181 | 185 | 180 |
| 23.02.2021 | 179 | 182 | 178 |
| 22.02.2021 | 176 | 179 | 174 |
| 21.02.2021 | 173 | 175 | 172 |
| 20.02.2021 | 168 | 172 | 165 |
| 19.02.2021 | 164 | 169 | 162 |
© Bayerisches Landesamt für Umwelt 2024