
- Startseite >
- Flüsse >
- Wasserstand >
- Oberer Main - Elbe >
- Neukenroth >
- Jahresgrafik

Jahresgrafik Neukenroth / Haßlach
Wasserstand vom 22.09.2022 bis zum 21.09.2023
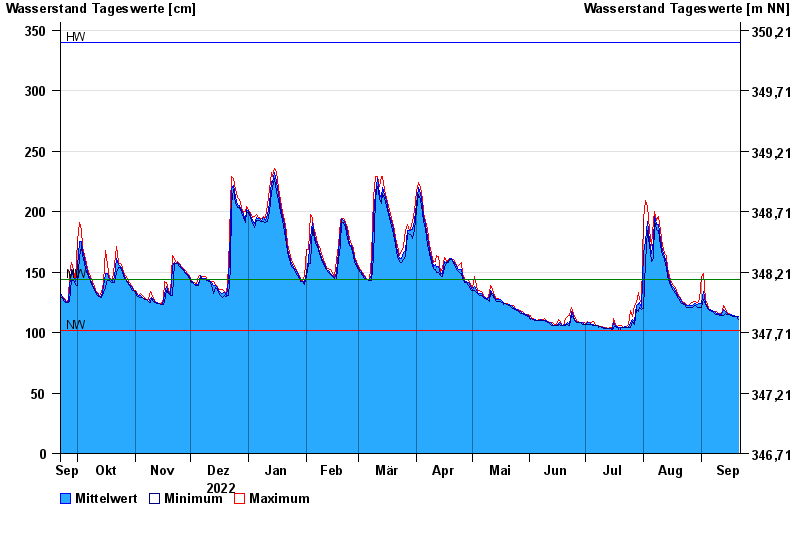
| Datum | Mittelwert [cm] | Maximum [cm] | Minimum [cm] |
|---|---|---|---|
| 21.09.2023 | 113 | 113 | 111 |
| 20.09.2023 | 113 | 113 | 113 |
| 19.09.2023 | 114 | 114 | 113 |
| 18.09.2023 | 114 | 114 | 113 |
| 17.09.2023 | 115 | 115 | 114 |
| 16.09.2023 | 115 | 116 | 115 |
| 15.09.2023 | 116 | 116 | 115 |
© Bayerisches Landesamt für Umwelt 2024