
- Startseite >
- Flüsse >
- Wasserstand >
- Oberer Main - Elbe >
- Neukenroth >
- Jahresgrafik

Jahresgrafik Neukenroth / Haßlach
Wasserstand vom 01.01.2018 bis zum 31.12.2018
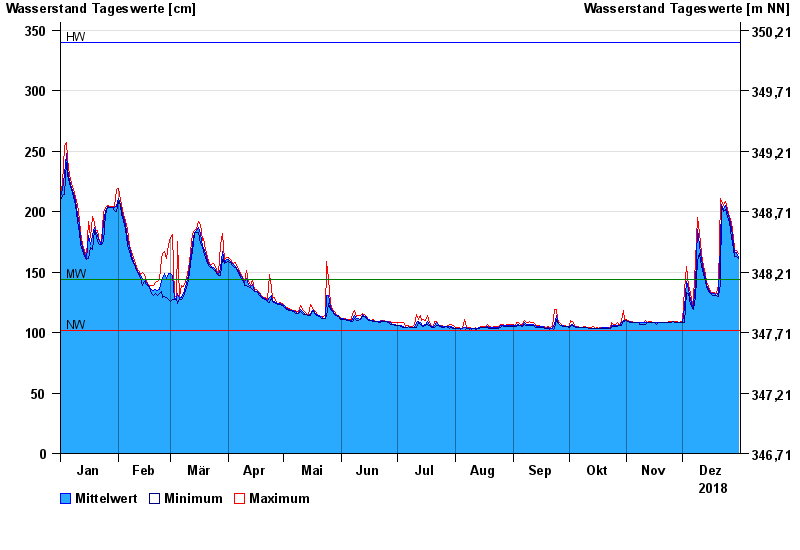
| Datum | Mittelwert [cm] | Maximum [cm] | Minimum [cm] |
|---|---|---|---|
| 31.12.2018 | 162 | 165 | 161 |
| 30.12.2018 | 166 | 168 | 163 |
| 29.12.2018 | 166 | 169 | 163 |
| 28.12.2018 | 173 | 179 | 169 |
| 27.12.2018 | 186 | 191 | 179 |
| 26.12.2018 | 194 | 196 | 191 |
| 25.12.2018 | 199 | 202 | 196 |
© Bayerisches Landesamt für Umwelt 2024