
- Startseite >
- Flüsse >
- Wasserstand >
- Oberer Main - Elbe >
- Neukenroth >
- Jahresgrafik

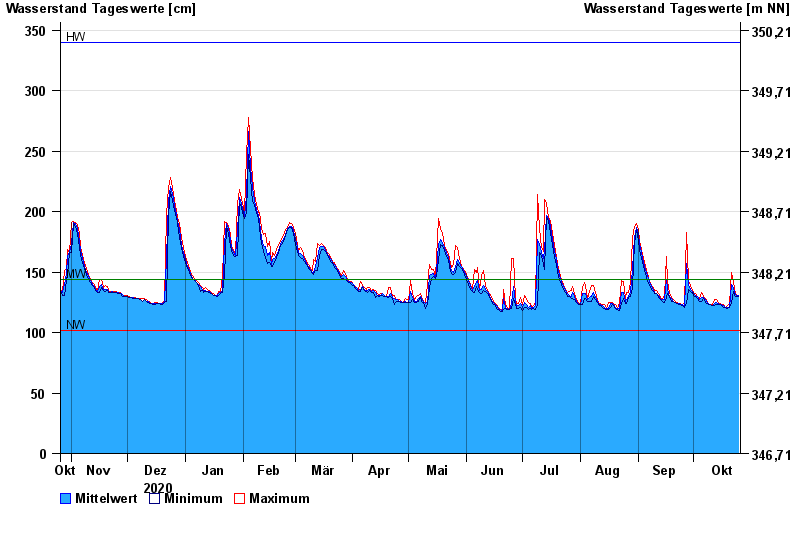
Jahresgrafik Neukenroth / Haßlach
Wasserstand vom 26.10.2020 bis zum 25.10.2021
| Datum | Mittelwert [cm] | Maximum [cm] | Minimum [cm] |
|---|---|---|---|
| 25.10.2021 | 131 | 131 | 130 |
| 24.10.2021 | 131 | 131 | 130 |
| 23.10.2021 | 133 | 136 | 131 |
| 22.10.2021 | 137 | 142 | 134 |
| 21.10.2021 | 140 | 150 | 124 |
| 20.10.2021 | 121 | 124 | 121 |
| 19.10.2021 | 121 | 122 | 120 |
© Bayerisches Landesamt für Umwelt 2024