
- Startseite >
- Flüsse >
- Wasserstand >
- Oberer Main - Elbe >
- Muggendorf >
- Jahresgrafik

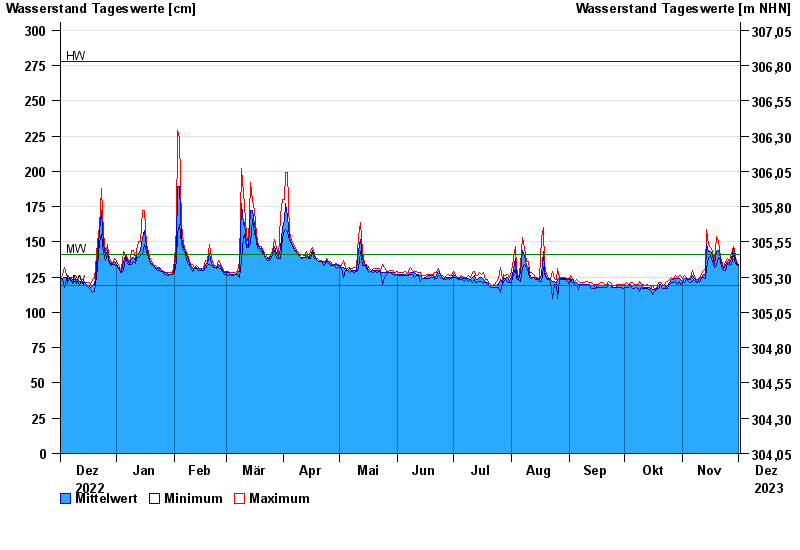
Jahresgrafik Muggendorf / Wiesent
Wasserstand vom 02.12.2022 bis zum 01.12.2023
| Datum | Mittelwert [cm] | Maximum [cm] | Minimum [cm] |
|---|---|---|---|
| 01.12.2023 | 133 | 134 | 133 |
| 30.11.2023 | 135 | 136 | 134 |
| 29.11.2023 | 140 | 144 | 136 |
| 28.11.2023 | 145 | 147 | 142 |
| 27.11.2023 | 138 | 142 | 134 |
| 26.11.2023 | 135 | 136 | 133 |
| 25.11.2023 | 136 | 138 | 135 |
© Bayerisches Landesamt für Umwelt 2024