
- Startseite >
- Flüsse >
- Wasserstand >
- Oberer Main - Elbe >
- Lichtenfels >
- Jahresgrafik

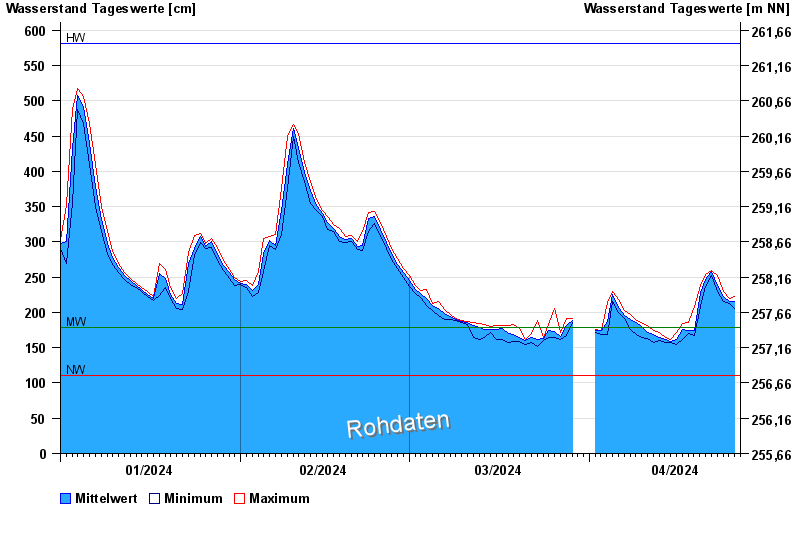
Jahresgrafik Lichtenfels / Main
Wasserstand vom 01.01.2024 bis zum 26.04.2024
| Datum | Mittelwert [cm] | Maximum [cm] | Minimum [cm] |
|---|---|---|---|
| 26.04.2024 | 219 | 222 | 217 |
| 25.04.2024 | 216 | 219 | 212 |
| 24.04.2024 | 222 | 230 | 215 |
| 23.04.2024 | 238 | 252 | 229 |
| 22.04.2024 | 258 | 260 | 252 |
| 21.04.2024 | 247 | 254 | 237 |
| 20.04.2024 | 228 | 238 | 209 |
© Bayerisches Landesamt für Umwelt 2024