
- Startseite >
- Flüsse >
- Wasserstand >
- Oberer Main - Elbe >
- Langenau >
- Jahresgrafik

Jahresgrafik Langenau / Langenaubach
Wasserstand vom 27.01.2023 bis zum 26.01.2024
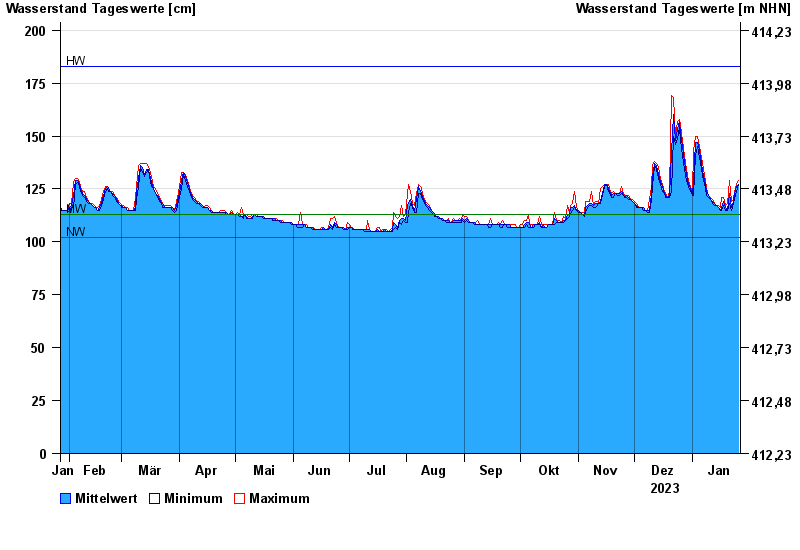
| Datum | Mittelwert [cm] | Maximum [cm] | Minimum [cm] |
|---|---|---|---|
| 26.01.2024 | 127 | 129 | 127 |
| 25.01.2024 | 126 | 127 | 124 |
| 24.01.2024 | 123 | 124 | 120 |
| 23.01.2024 | 119 | 120 | 118 |
| 22.01.2024 | 116 | 119 | 115 |
| 21.01.2024 | 123 | 129 | 118 |
| 20.01.2024 | 115 | 118 | 115 |
© Bayerisches Landesamt für Umwelt 2024