
- Startseite >
- Flüsse >
- Wasserstand >
- Oberer Main - Elbe >
- Langenau >
- Jahresgrafik

Jahresgrafik Langenau / Langenaubach
Wasserstand vom 24.06.2021 bis zum 23.06.2022
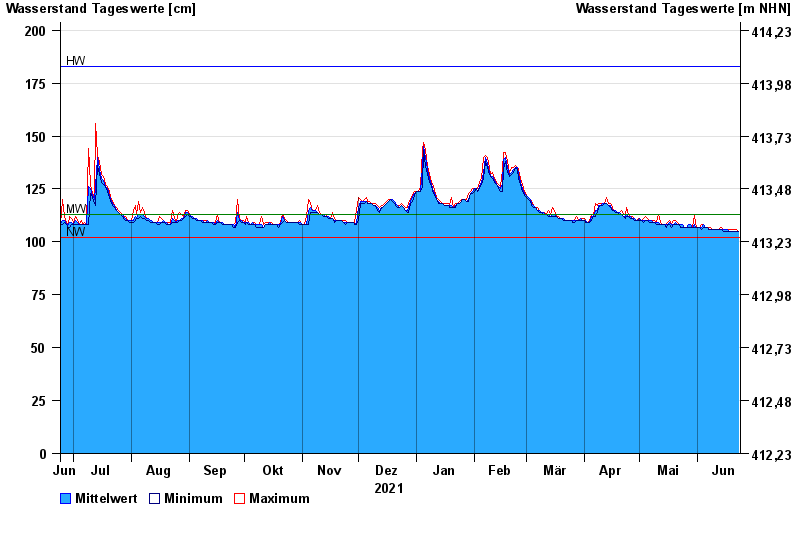
| Datum | Mittelwert [cm] | Maximum [cm] | Minimum [cm] |
|---|---|---|---|
| 23.06.2022 | 105 | 105 | 105 |
| 22.06.2022 | 105 | 106 | 105 |
| 21.06.2022 | 105 | 106 | 105 |
| 20.06.2022 | 105 | 106 | 105 |
| 19.06.2022 | 105 | 106 | 105 |
| 18.06.2022 | 105 | 106 | 105 |
| 17.06.2022 | 106 | 106 | 105 |
© Bayerisches Landesamt für Umwelt 2024