
- Startseite >
- Flüsse >
- Wasserstand >
- Oberer Main - Elbe >
- Hollfeld >
- Jahresgrafik

Jahresgrafik Hollfeld / Wiesent
Wasserstand vom 19.01.2022 bis zum 18.01.2023
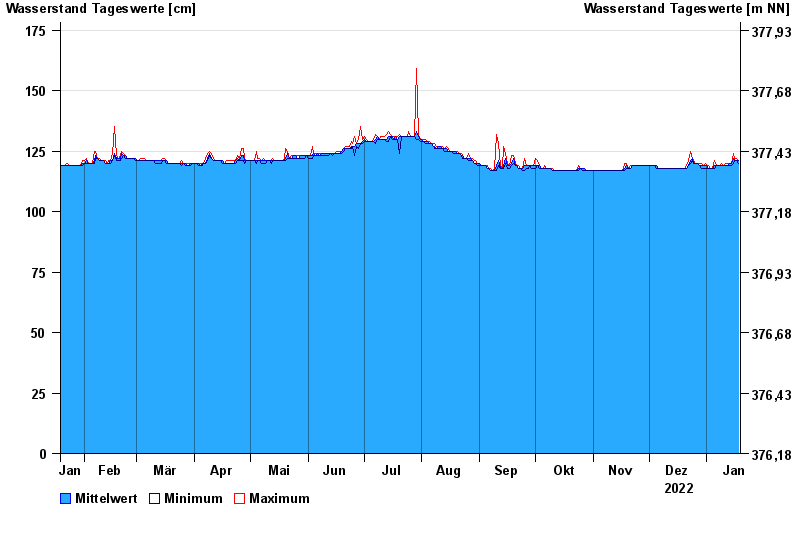
| Datum | Mittelwert [cm] | Maximum [cm] | Minimum [cm] |
|---|---|---|---|
| 18.01.2023 | 121 | 121 | 120 |
| 17.01.2023 | 121 | 122 | 121 |
| 16.01.2023 | 121 | 122 | 121 |
| 15.01.2023 | 122 | 124 | 120 |
| 14.01.2023 | 120 | 120 | 119 |
| 13.01.2023 | 120 | 120 | 119 |
| 12.01.2023 | 119 | 120 | 119 |
© Bayerisches Landesamt für Umwelt 2024