
- Startseite >
- Flüsse >
- Wasserstand >
- Oberer Main - Elbe >
- Hallerndorf >
- Jahresgrafik

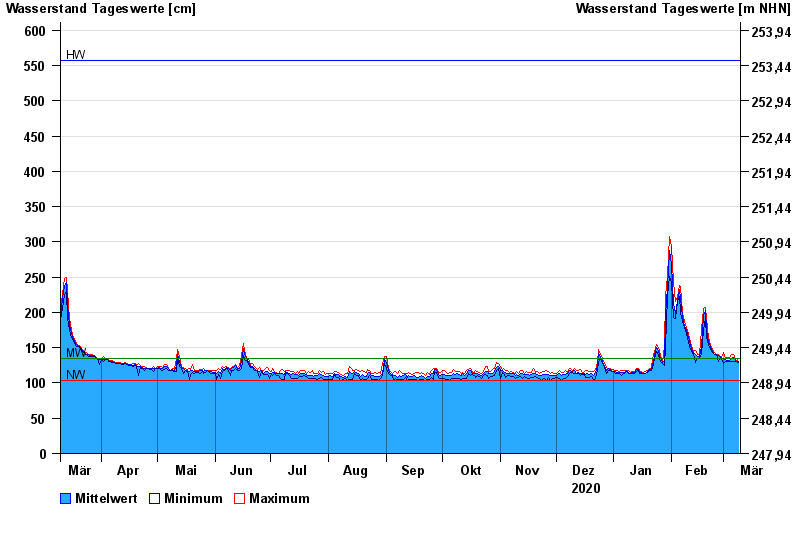
Jahresgrafik Hallerndorf / Aisch
Wasserstand vom 10.03.2020 bis zum 09.03.2021
| Datum | Mittelwert [cm] | Maximum [cm] | Minimum [cm] |
|---|---|---|---|
| 09.03.2021 | 131 | 135 | 129 |
| 08.03.2021 | 130 | 131 | 130 |
| 07.03.2021 | 134 | 137 | 130 |
| 06.03.2021 | 136 | 141 | 131 |
| 05.03.2021 | 135 | 140 | 131 |
| 04.03.2021 | 132 | 136 | 130 |
| 03.03.2021 | 132 | 136 | 130 |
© Bayerisches Landesamt für Umwelt 2024