
- Startseite >
- Flüsse >
- Wasserstand >
- Oberer Main - Elbe >
- Hallerndorf >
- Jahresgrafik

Jahresgrafik Hallerndorf / Aisch
Wasserstand vom 04.06.2020 bis zum 03.06.2021
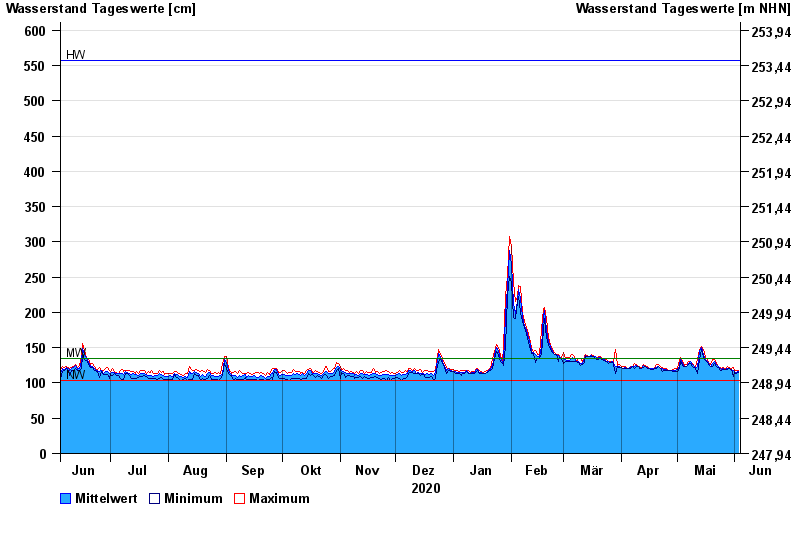
| Datum | Mittelwert [cm] | Maximum [cm] | Minimum [cm] |
|---|---|---|---|
| 03.06.2021 | 116 | 117 | 115 |
| 02.06.2021 | 115 | 117 | 113 |
| 01.06.2021 | 116 | 118 | 115 |
| 31.05.2021 | 118 | 122 | 109 |
| 30.05.2021 | 119 | 121 | 119 |
| 29.05.2021 | 121 | 122 | 120 |
| 28.05.2021 | 120 | 123 | 119 |
© Bayerisches Landesamt für Umwelt 2024