
- Startseite >
- Flüsse >
- Wasserstand >
- Oberer Main - Elbe >
- Grafenwöhr >
- Jahresgrafik

Jahresgrafik Grafenwöhr / Creußen
Wasserstand vom 19.04.2024 bis zum 18.04.2025
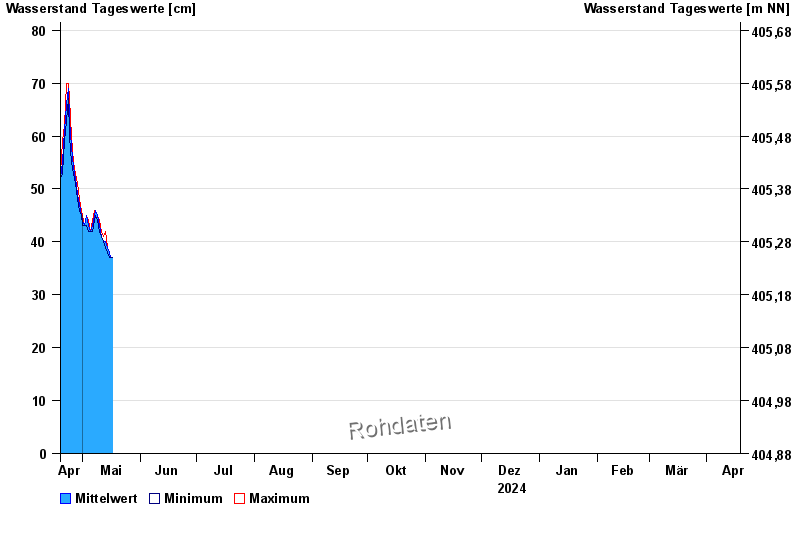
| Datum | Mittelwert [cm] | Maximum [cm] | Minimum [cm] |
|---|---|---|---|
| 30.04.2024 | 46 | 46 | 45 |
| 29.04.2024 | 47 | 48 | 46 |
| 28.04.2024 | 49 | 51 | 48 |
| 27.04.2024 | 52 | 53 | 51 |
| 26.04.2024 | 54 | 55 | 53 |
| 25.04.2024 | 58 | 60 | 55 |
| 24.04.2024 | 63 | 67 | 60 |
© Bayerisches Landesamt für Umwelt 2024