
- Startseite >
- Flüsse >
- Wasserstand >
- Oberer Main - Elbe >
- Goldbergsee Ablauf >
- Jahresgrafik

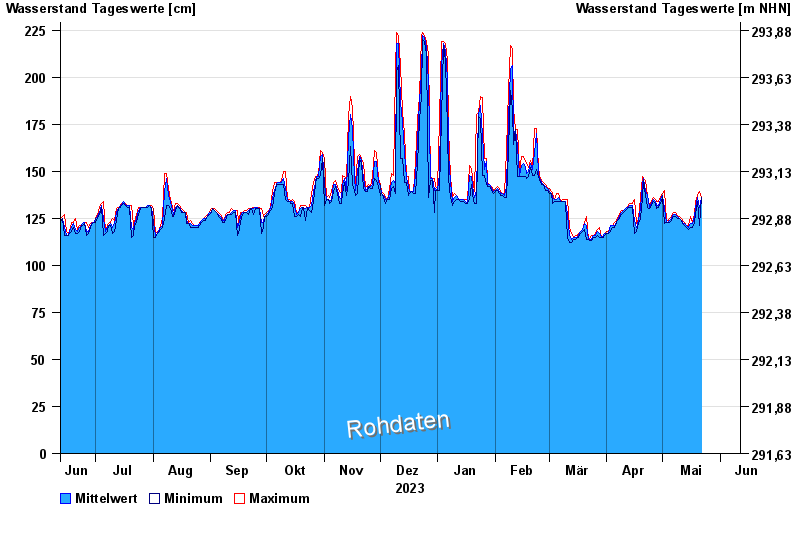
Jahresgrafik Goldbergsee Ablauf / Sulzbach
Wasserstand vom 12.06.2023 bis zum 11.06.2024
Hinweis
Beeinflussung des Abflusses aufgrund Hindernisse im Unterlauf.
- 24.12.2012 Wasserstand: 257 cm
- 28.02.2009 Wasserstand: 252 cm
- 17.12.2012 Wasserstand: 246 cm
- 09.01.2011 Wasserstand: 241 cm
- 26.02.2010 Wasserstand: 240 cm
| Datum | Mittelwert [cm] | Maximum [cm] | Minimum [cm] |
|---|---|---|---|
| 03.06.2024 | 165 | 201 | 144 |
| 02.06.2024 | 212 | 215 | 195 |
| 01.06.2024 | 145 | 193 | 136 |
| 31.05.2024 | 146 | 149 | 136 |
| 30.05.2024 | 132 | 145 | 122 |
| 29.05.2024 | 122 | 122 | 121 |
| 28.05.2024 | 123 | 123 | 121 |
© Bayerisches Landesamt für Umwelt 2024