
- Startseite >
- Flüsse >
- Wasserstand >
- Oberer Main - Elbe >
- Erbendorf >
- Jahresgrafik

Jahresgrafik Erbendorf / Fichtelnaab
Wasserstand vom 20.04.2024 bis zum 19.04.2025
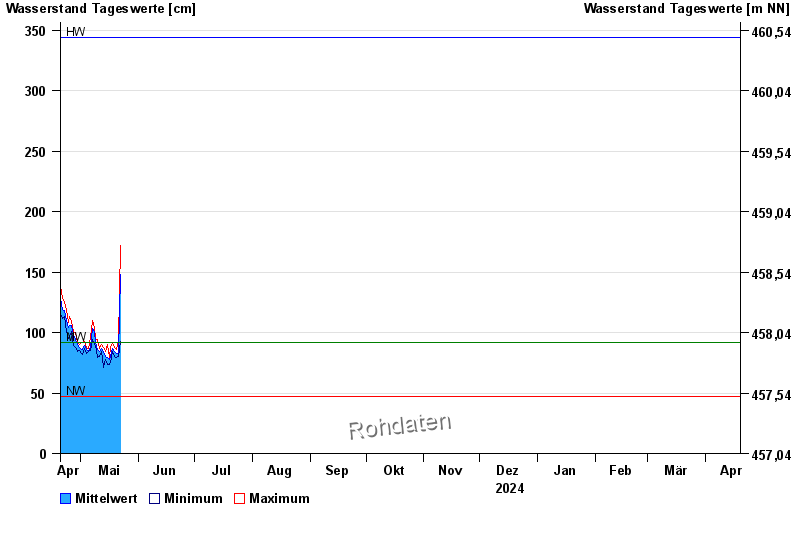
| Datum | Mittelwert [cm] | Maximum [cm] | Minimum [cm] |
|---|---|---|---|
| 02.05.2024 | 85 | 92 | 82 |
| 01.05.2024 | 86 | 92 | 83 |
| 30.04.2024 | 88 | 90 | 85 |
| 29.04.2024 | 90 | 92 | 84 |
| 28.04.2024 | 94 | 100 | 88 |
| 27.04.2024 | 98 | 101 | 89 |
| 26.04.2024 | 106 | 109 | 101 |
© Bayerisches Landesamt für Umwelt 2024