
- Startseite >
- Flüsse >
- Wasserstand >
- Bayern >
- Winkl >
- Jahresgrafik

Jahresgrafik Winkl / Verlorener Bach
Wasserstand vom 01.01.2024 bis zum 31.12.2024
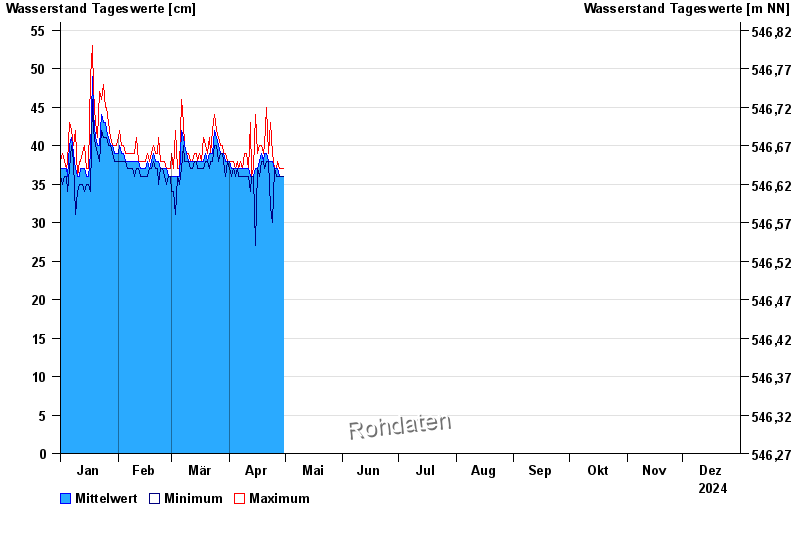
Hinweis
Messwerte beeinflusst durch Kraftwerkssteuerungen.
| Datum | Mittelwert [cm] | Maximum [cm] | Minimum [cm] |
|---|---|---|---|
| 03.06.2024 | 64 | 77 | 60 |
| 02.06.2024 | 78 | 101 | 63 |
| 01.06.2024 | 103 | 124 | 67 |
| 31.05.2024 | 57 | 84 | 40 |
| 30.05.2024 | 40 | 44 | 37 |
| 29.05.2024 | 37 | 37 | 36 |
| 28.05.2024 | 38 | 40 | 34 |
© Bayerisches Landesamt für Umwelt 2024