
- Startseite >
- Flüsse >
- Wasserstand >
- Bayern >
- Wiblingen >
- Jahresgrafik

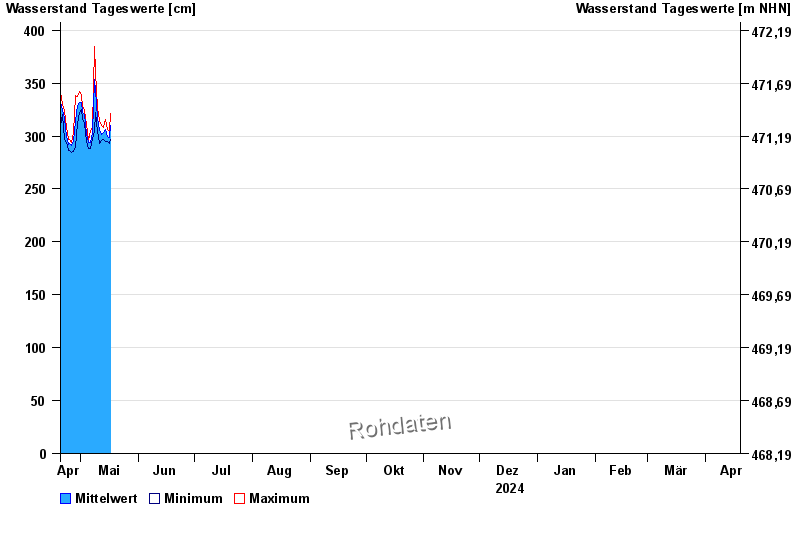
Jahresgrafik Wiblingen / Iller
Wasserstand vom 20.04.2024 bis zum 19.04.2025
- 23.05.1999 Wasserstand: 752 cm
- 24.08.2005 Wasserstand: 739 cm
- 02.06.2013 Wasserstand: 705 cm
- 13.08.2002 Wasserstand: 694 cm
- 13.05.1999 Wasserstand: 664 cm
| Datum | Mittelwert [cm] | Maximum [cm] | Minimum [cm] |
|---|---|---|---|
| 02.05.2024 | 323 | 328 | 320 |
| 01.05.2024 | 332 | 338 | 325 |
| 30.04.2024 | 332 | 342 | 322 |
| 29.04.2024 | 329 | 337 | 312 |
| 28.04.2024 | 314 | 338 | 290 |
| 27.04.2024 | 296 | 303 | 285 |
| 26.04.2024 | 291 | 294 | 284 |
© Bayerisches Landesamt für Umwelt 2024