
- Startseite >
- Flüsse >
- Wasserstand >
- Bayern >
- Weinzierlein >
- Jahresgrafik

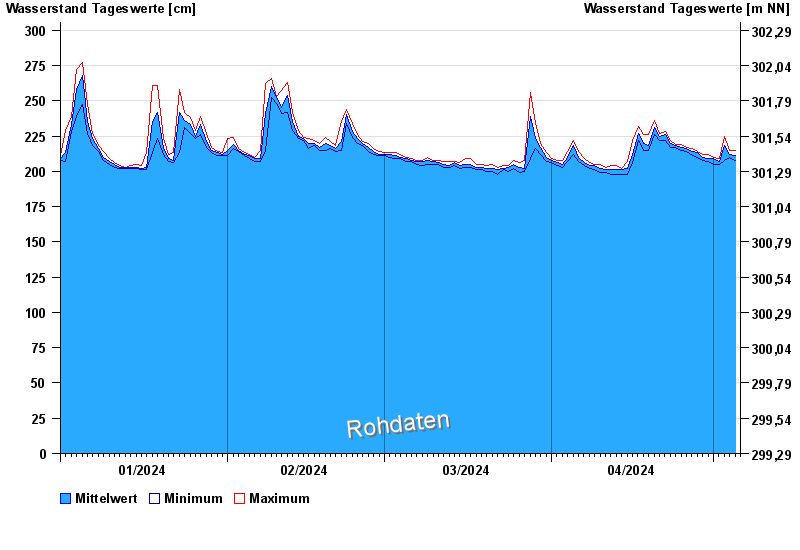
Jahresgrafik Weinzierlein / Bibert
Wasserstand vom 01.01.2024 bis zum 05.05.2024
 Für diesen Pegel sind keine Hochwassermarken hinterlegt.
| Datum | Mittelwert [cm] | Maximum [cm] | Minimum [cm] |
|---|---|---|---|
| 05.05.2024 | 210 | 211 | 209 |
| 04.05.2024 | 212 | 215 | 210 |
| 03.05.2024 | 218 | 225 | 208 |
| 02.05.2024 | 207 | 209 | 205 |
| 01.05.2024 | 209 | 210 | 205 |
| 30.04.2024 | 209 | 212 | 207 |
| 29.04.2024 | 210 | 212 | 208 |
© Bayerisches Landesamt für Umwelt 2024