
- Startseite >
- Flüsse >
- Wasserstand >
- Bayern >
- Weiden >
- Jahresgrafik

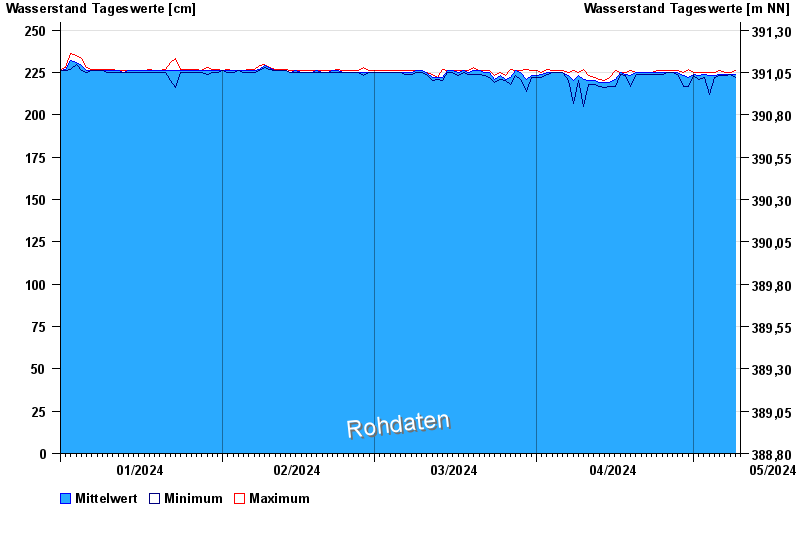
Jahresgrafik Weiden / Waldnaab
Wasserstand vom 01.01.2024 bis zum 09.05.2024
 Für diesen Pegel sind keine historische Ereignisse hinterlegt.
| Datum | Mittelwert [cm] | Maximum [cm] | Minimum [cm] |
|---|---|---|---|
| 09.05.2024 | 224 | 224 | 224 |
| 08.05.2024 | 224 | 225 | 224 |
| 07.05.2024 | 224 | 225 | 223 |
| 06.05.2024 | 224 | 226 | 223 |
| 05.05.2024 | 223 | 225 | 222 |
| 04.05.2024 | 223 | 225 | 212 |
| 03.05.2024 | 224 | 225 | 222 |
© Bayerisches Landesamt für Umwelt 2024