
- Startseite >
- Flüsse >
- Wasserstand >
- Bayern >
- Viechtach Reibenmühle >
- Jahresgrafik

Jahresgrafik Viechtach Reibenmühle / Aitnach
Wasserstand vom 17.01.2022 bis zum 16.01.2023
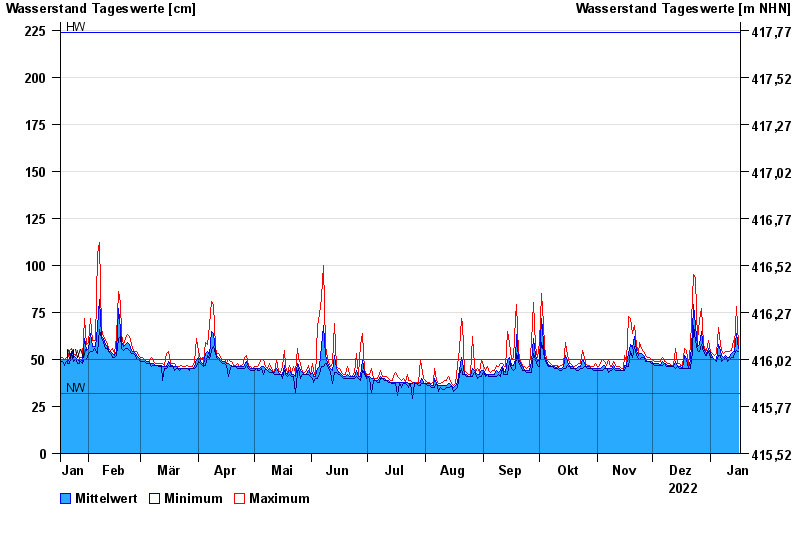
| Datum | Mittelwert [cm] | Maximum [cm] | Minimum [cm] |
|---|---|---|---|
| 16.01.2023 | 56 | 58 | 54 |
| 15.01.2023 | 64 | 78 | 55 |
| 14.01.2023 | 54 | 57 | 53 |
| 13.01.2023 | 54 | 60 | 51 |
| 12.01.2023 | 53 | 55 | 51 |
| 11.01.2023 | 51 | 54 | 50 |
| 10.01.2023 | 51 | 54 | 49 |
© Bayerisches Landesamt für Umwelt 2024