
- Startseite >
- Flüsse >
- Wasserstand >
- Bayern >
- Unterbruck >
- Jahresgrafik

Jahresgrafik Unterbruck / Haidenaab
Wasserstand vom 24.04.2024 bis zum 23.04.2025
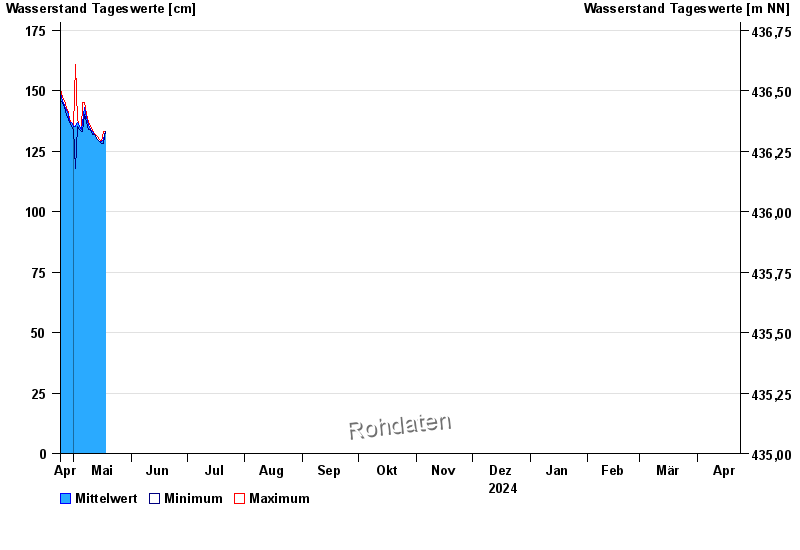
- Hochwassergefahrenfläche HQ100 320 cm
| Datum | Mittelwert [cm] | Maximum [cm] | Minimum [cm] |
|---|---|---|---|
| 03.05.2024 | 137 | 138 | 135 |
| 02.05.2024 | 135 | 161 | 118 |
| 01.05.2024 | 135 | 135 | 134 |
| 30.04.2024 | 137 | 137 | 135 |
| 29.04.2024 | 137 | 138 | 137 |
| 28.04.2024 | 140 | 141 | 138 |
| 27.04.2024 | 142 | 143 | 140 |
© Bayerisches Landesamt für Umwelt 2024