
- Startseite >
- Flüsse >
- Wasserstand >
- Bayern >
- Titting >
- Jahresgrafik

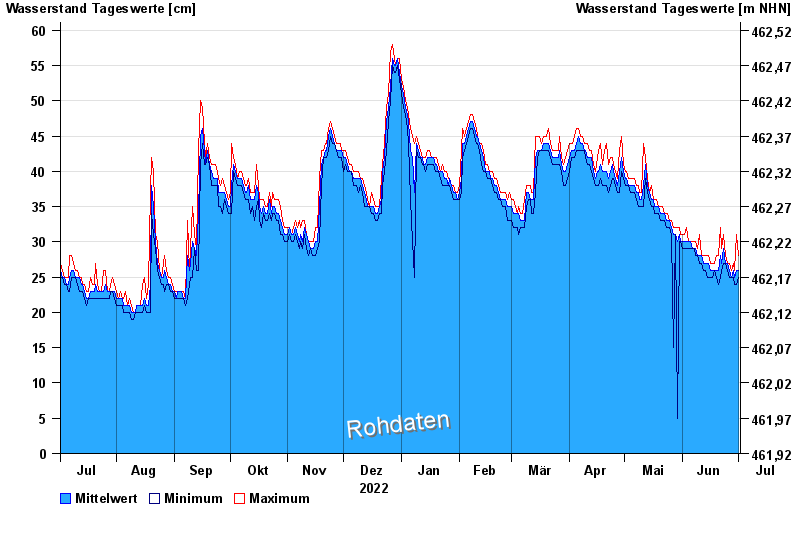
Jahresgrafik Titting / Anlauter
Wasserstand vom 02.07.2022 bis zum 01.07.2023
 Für diesen Pegel sind keine historische Ereignisse hinterlegt.
| Datum | Mittelwert [cm] | Maximum [cm] | Minimum [cm] |
|---|---|---|---|
| 01.07.2023 | 26 | 28 | 25 |
| 30.06.2023 | 26 | 31 | 24 |
| 29.06.2023 | 25 | 26 | 24 |
| 28.06.2023 | 26 | 27 | 25 |
| 27.06.2023 | 25 | 26 | 25 |
| 26.06.2023 | 26 | 27 | 25 |
| 25.06.2023 | 27 | 27 | 26 |
© Bayerisches Landesamt für Umwelt 2024