
- Startseite >
- Flüsse >
- Wasserstand >
- Bayern >
- Stein bei Altenmarkt >
- Jahresgrafik

Jahresgrafik Stein bei Altenmarkt / Traun
Wasserstand vom 22.03.2024 bis zum 21.03.2025
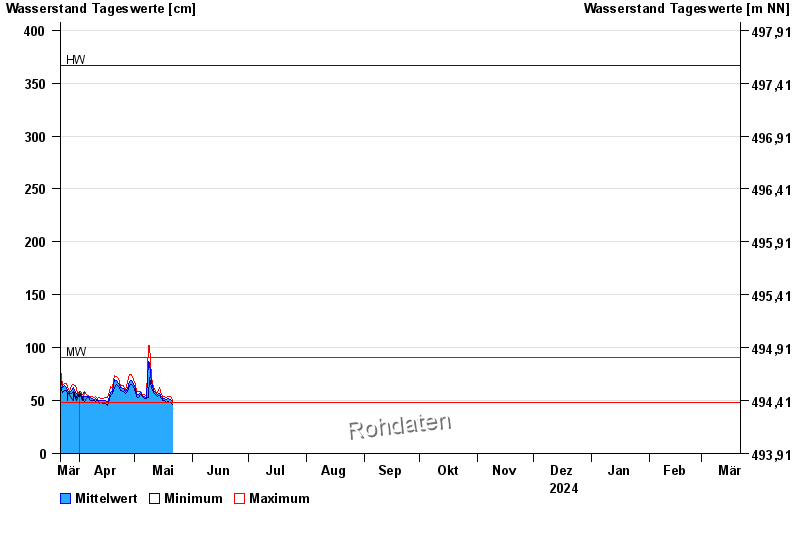
| Datum | Mittelwert [cm] | Maximum [cm] | Minimum [cm] |
|---|---|---|---|
| 03.05.2024 | 55 | 59 | 53 |
| 02.05.2024 | 57 | 59 | 54 |
| 01.05.2024 | 61 | 65 | 58 |
| 30.04.2024 | 66 | 70 | 63 |
| 29.04.2024 | 69 | 75 | 65 |
| 28.04.2024 | 68 | 75 | 64 |
| 27.04.2024 | 61 | 67 | 59 |
© Bayerisches Landesamt für Umwelt 2024