
- Startseite >
- Flüsse >
- Wasserstand >
- Bayern >
- Seltmans >
- Jahresgrafik

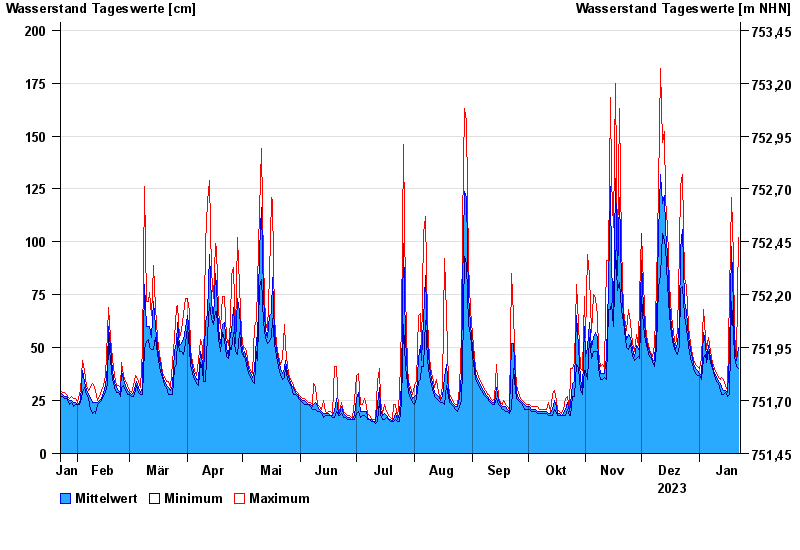
Jahresgrafik Seltmans / Untere Argen
Wasserstand vom 23.01.2023 bis zum 22.01.2024
| Datum | Mittelwert [cm] | Maximum [cm] | Minimum [cm] |
|---|---|---|---|
| 22.01.2024 | 50 | 102 | 40 |
| 21.01.2024 | 44 | 46 | 41 |
| 20.01.2024 | 51 | 56 | 46 |
| 19.01.2024 | 69 | 93 | 56 |
| 18.01.2024 | 98 | 121 | 72 |
| 17.01.2024 | 47 | 75 | 28 |
| 16.01.2024 | 29 | 30 | 27 |
© Bayerisches Landesamt für Umwelt 2024