
- Startseite >
- Flüsse >
- Wasserstand >
- Bayern >
- Seltmans >
- Jahresgrafik

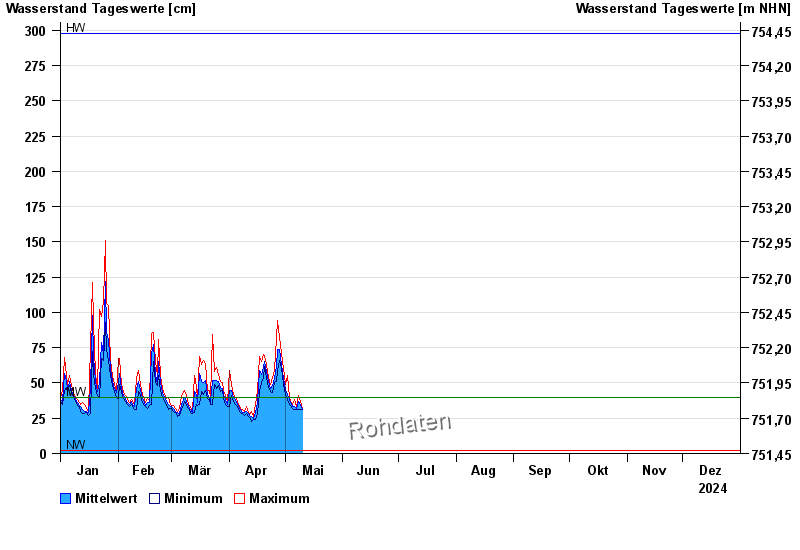
Jahresgrafik Seltmans / Untere Argen
Wasserstand vom 01.01.2024 bis zum 31.12.2024
| Datum | Mittelwert [cm] | Maximum [cm] | Minimum [cm] |
|---|---|---|---|
| 14.05.2024 | 28 | 29 | 27 |
| 13.05.2024 | 29 | 33 | 27 |
| 12.05.2024 | 28 | 29 | 26 |
| 11.05.2024 | 29 | 30 | 27 |
| 10.05.2024 | 31 | 32 | 29 |
| 09.05.2024 | 34 | 37 | 31 |
| 08.05.2024 | 37 | 41 | 31 |
© Bayerisches Landesamt für Umwelt 2024