
- Startseite >
- Flüsse >
- Wasserstand >
- Bayern >
- Schweinfurt Neuer Hafen >
- Jahresgrafik

Jahresgrafik Schweinfurt Neuer Hafen / Main
Wasserstand vom 01.01.2022 bis zum 31.12.2022
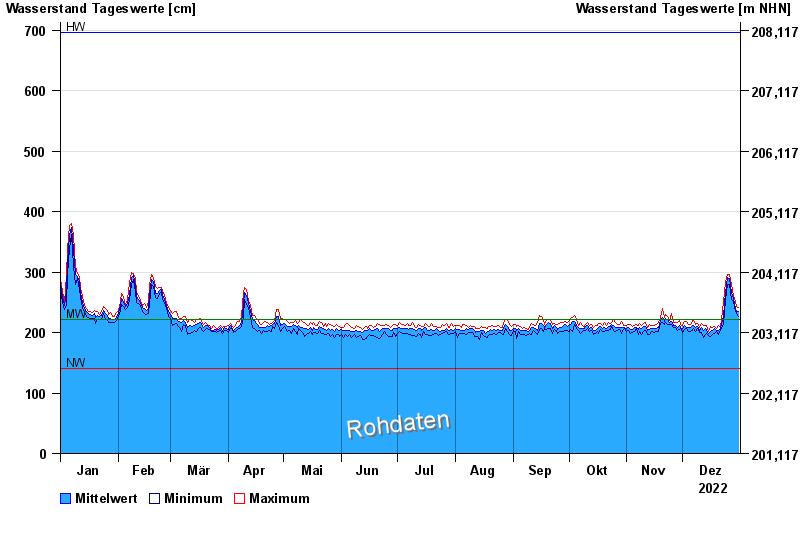
| Datum | Mittelwert [cm] | Maximum [cm] | Minimum [cm] |
|---|---|---|---|
| 31.12.2022 | 234 | 241 | 226 |
| 30.12.2022 | 235 | 243 | 231 |
| 29.12.2022 | 247 | 256 | 241 |
| 28.12.2022 | 257 | 262 | 251 |
| 27.12.2022 | 266 | 280 | 254 |
| 26.12.2022 | 290 | 296 | 280 |
| 25.12.2022 | 291 | 296 | 280 |
© Bayerisches Landesamt für Umwelt 2024