
- Startseite >
- Flüsse >
- Wasserstand >
- Bayern >
- Schmidmühlen >
- Jahresgrafik

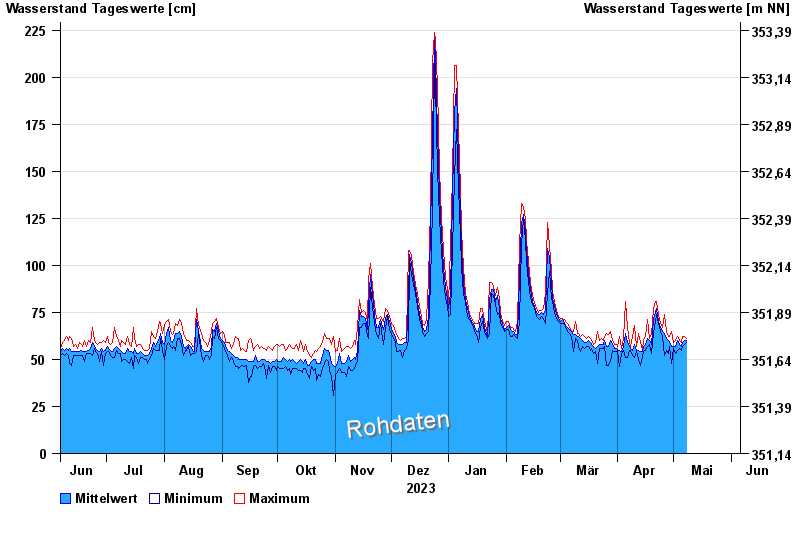
Jahresgrafik Schmidmühlen / Vils
Wasserstand vom 06.06.2023 bis zum 05.06.2024
 Für diesen Pegel sind keine Meldestufen hinterlegt.
| Datum | Mittelwert [cm] | Maximum [cm] | Minimum [cm] |
|---|---|---|---|
| 05.06.2024 | 111 | 125 | 98 |
| 04.06.2024 | 135 | 149 | 125 |
| 03.06.2024 | 185 | 208 | 149 |
| 02.06.2024 | 196 | 206 | 152 |
| 01.06.2024 | 100 | 152 | 80 |
| 31.05.2024 | 72 | 80 | 69 |
| 30.05.2024 | 67 | 75 | 61 |
© Bayerisches Landesamt für Umwelt 2025