
- Startseite >
- Flüsse >
- Wasserstand >
- Bayern >
- Schmerold >
- Jahresgrafik

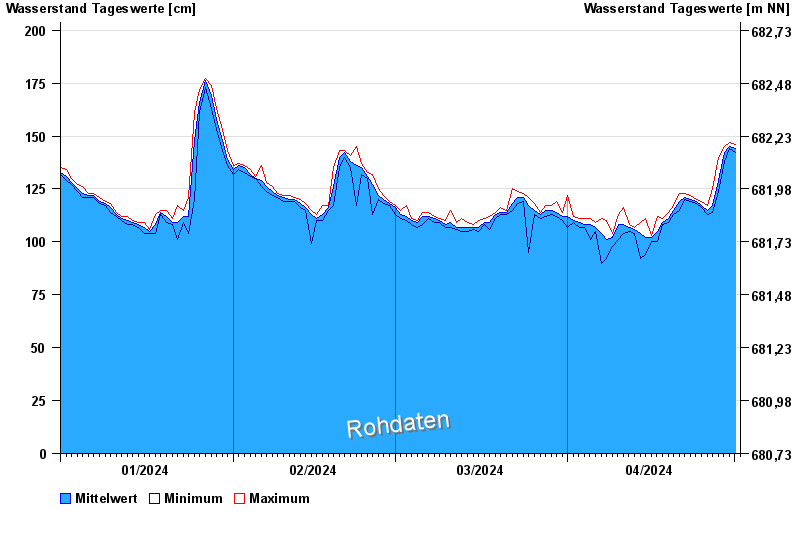
Jahresgrafik Schmerold / Mangfall
Wasserstand vom 01.01.2024 bis zum 01.05.2024
 Für diesen Pegel sind keine Hochwassermarken hinterlegt.
| Datum | Mittelwert [cm] | Maximum [cm] | Minimum [cm] |
|---|---|---|---|
| 01.05.2024 | 146 | 146 | 145 |
| 30.04.2024 | 145 | 147 | 144 |
| 29.04.2024 | 142 | 145 | 138 |
| 28.04.2024 | 129 | 140 | 124 |
| 27.04.2024 | 117 | 125 | 114 |
| 26.04.2024 | 115 | 117 | 113 |
| 25.04.2024 | 117 | 119 | 116 |
© Bayerisches Landesamt für Umwelt 2024