
- Startseite >
- Flüsse >
- Wasserstand >
- Bayern >
- Schlehenmühle >
- Jahresgrafik

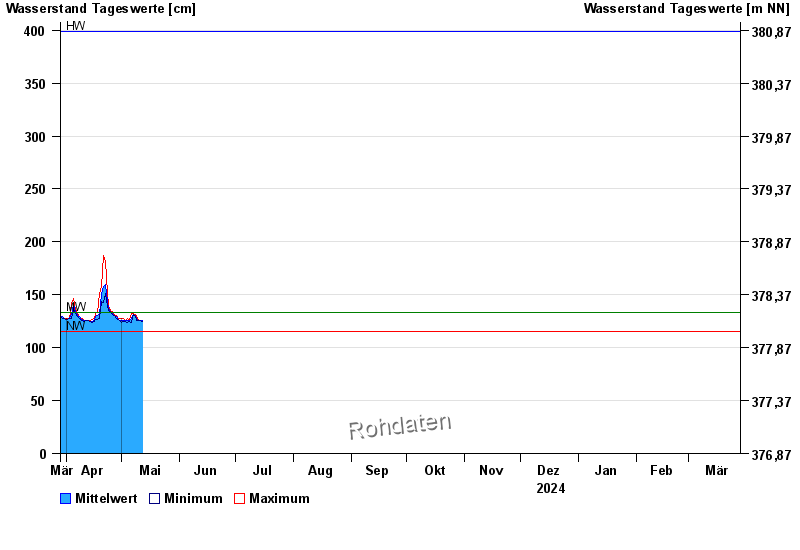
Jahresgrafik Schlehenmühle / Roter Main
Wasserstand vom 29.03.2024 bis zum 28.03.2025
| Datum | Mittelwert [cm] | Maximum [cm] | Minimum [cm] |
|---|---|---|---|
| 11.05.2024 | 126 | 126 | 126 |
| 10.05.2024 | 126 | 127 | 126 |
| 09.05.2024 | 128 | 129 | 126 |
| 08.05.2024 | 130 | 131 | 129 |
| 07.05.2024 | 131 | 132 | 131 |
| 06.05.2024 | 128 | 132 | 124 |
| 05.05.2024 | 126 | 127 | 125 |
© Bayerisches Landesamt für Umwelt 2024