
- Startseite >
- Flüsse >
- Wasserstand >
- Bayern >
- Schlehenmühle >
- Jahresgrafik

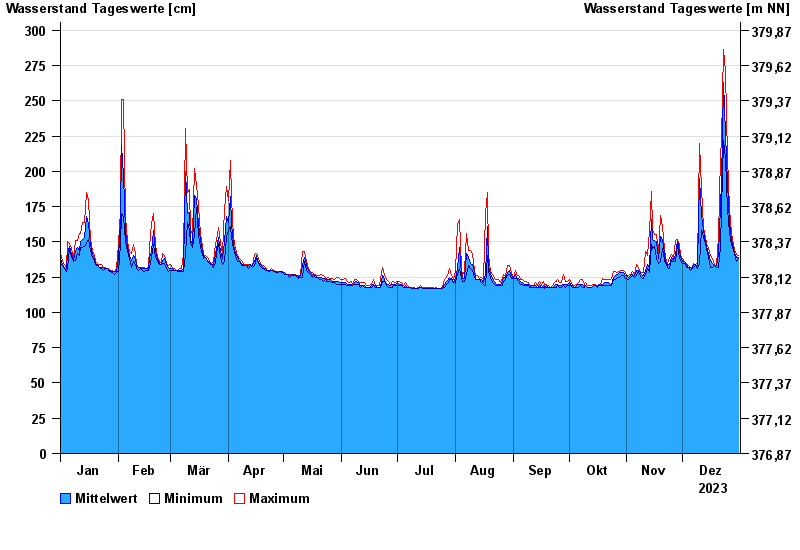
Jahresgrafik Schlehenmühle / Roter Main
Wasserstand vom 01.01.2023 bis zum 31.12.2023
 Für diesen Pegel sind keine Meldestufen hinterlegt.
| Datum | Mittelwert [cm] | Maximum [cm] | Minimum [cm] |
|---|---|---|---|
| 31.12.2023 | 139 | 140 | 138 |
| 30.12.2023 | 139 | 141 | 136 |
| 29.12.2023 | 142 | 144 | 141 |
| 28.12.2023 | 145 | 148 | 144 |
| 27.12.2023 | 152 | 156 | 148 |
| 26.12.2023 | 164 | 173 | 156 |
| 25.12.2023 | 191 | 210 | 173 |
© Bayerisches Landesamt für Umwelt 2025