
- Startseite >
- Flüsse >
- Wasserstand >
- Bayern >
- Scheinfeld >
- Jahresgrafik

Jahresgrafik Scheinfeld / Scheine
Wasserstand vom 01.01.2024 bis zum 31.12.2024
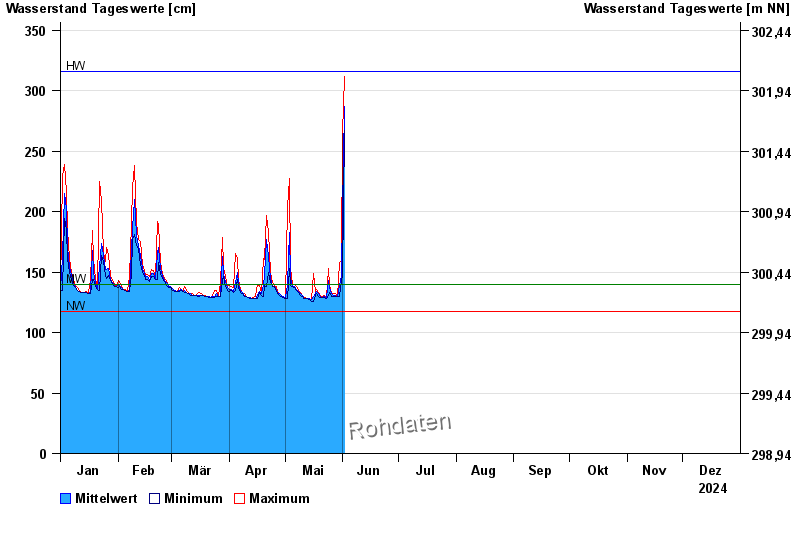
| Datum | Mittelwert [cm] | Maximum [cm] | Minimum [cm] |
|---|---|---|---|
| 14.06.2024 | 129 | 132 | 128 |
| 13.06.2024 | 132 | 132 | 131 |
| 12.06.2024 | 132 | 133 | 132 |
| 11.06.2024 | 133 | 133 | 132 |
| 10.06.2024 | 134 | 134 | 133 |
| 09.06.2024 | 135 | 136 | 134 |
| 08.06.2024 | 136 | 137 | 135 |
© Bayerisches Landesamt für Umwelt 2024