
- Startseite >
- Flüsse >
- Wasserstand >
- Bayern >
- Rasch >
- Jahresgrafik

Jahresgrafik Rasch / Schwarzach
Wasserstand vom 18.04.2024 bis zum 17.04.2025
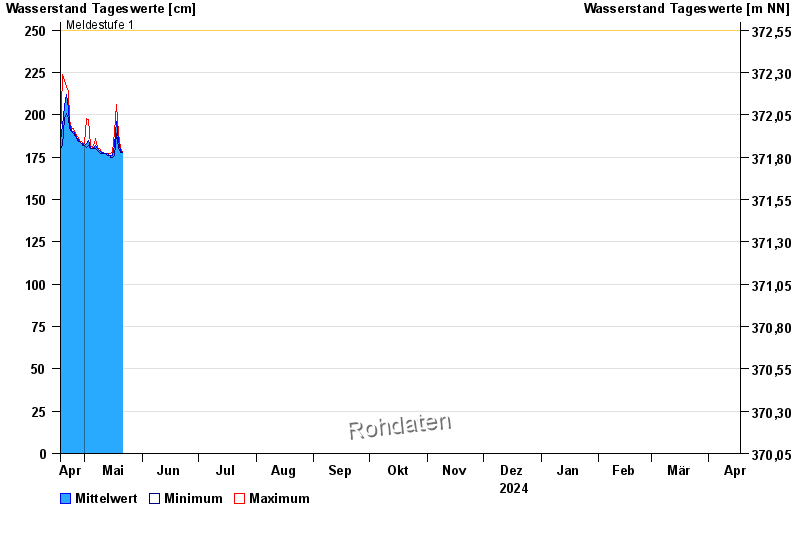
- Meldestufe 1 250 cm
- Meldestufe 2 280 cm
- Meldestufe 3 330 cm
- Meldestufe 4 400 cm
- Hochwassergefahrenfläche HQhäufig 380 cm
- Hochwassergefahrenfläche HQ100 430 cm
| Datum | Mittelwert [cm] | Maximum [cm] | Minimum [cm] |
|---|---|---|---|
| 21.05.2024 | 178 | 178 | 178 |
| 20.05.2024 | 179 | 181 | 178 |
| 19.05.2024 | 185 | 189 | 181 |
| 18.05.2024 | 196 | 206 | 189 |
| 17.05.2024 | 182 | 190 | 176 |
| 16.05.2024 | 176 | 178 | 175 |
| 15.05.2024 | 176 | 177 | 175 |
© Bayerisches Landesamt für Umwelt 2024