
- Startseite >
- Flüsse >
- Wasserstand >
- Bayern >
- Rasch >
- Jahresgrafik

Jahresgrafik Rasch / Schwarzach
Wasserstand vom 18.04.2024 bis zum 17.04.2025
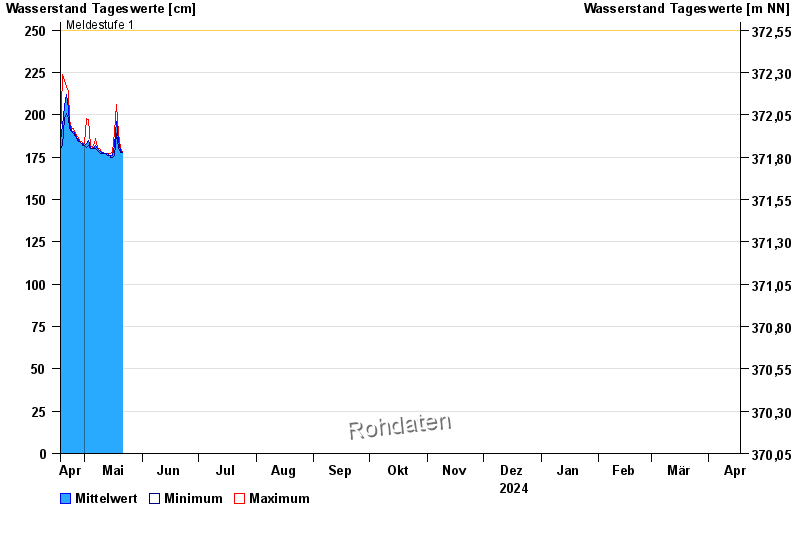
- Meldestufe 1 250 cm
- Meldestufe 2 280 cm
- Meldestufe 3 330 cm
- Meldestufe 4 400 cm
- Hochwassergefahrenfläche HQhäufig 380 cm
- Hochwassergefahrenfläche HQ100 430 cm
| Datum | Mittelwert [cm] | Maximum [cm] | Minimum [cm] |
|---|---|---|---|
| 03.06.2024 | 248 | 254 | 238 |
| 02.06.2024 | 305 | 360 | 243 |
| 01.06.2024 | 261 | 323 | 217 |
| 31.05.2024 | 197 | 218 | 188 |
| 30.05.2024 | 194 | 202 | 184 |
| 29.05.2024 | 185 | 187 | 184 |
| 28.05.2024 | 194 | 215 | 183 |
© Bayerisches Landesamt für Umwelt 2024