
- Startseite >
- Flüsse >
- Wasserstand >
- Bayern >
- Pfarrweisach >
- Jahresgrafik

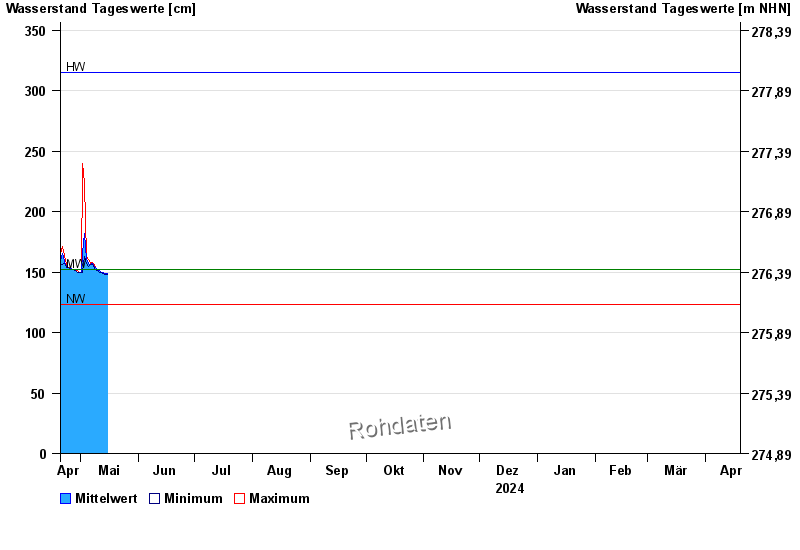
Jahresgrafik Pfarrweisach / Weisach
Wasserstand vom 20.04.2024 bis zum 19.04.2025
| Datum | Mittelwert [cm] | Maximum [cm] | Minimum [cm] |
|---|---|---|---|
| 03.05.2024 | 222 | 223 | 221 |
| 02.05.2024 | 166 | 240 | 150 |
| 01.05.2024 | 150 | 150 | 150 |
| 30.04.2024 | 150 | 150 | 150 |
| 29.04.2024 | 150 | 151 | 150 |
| 28.04.2024 | 151 | 152 | 151 |
| 27.04.2024 | 152 | 152 | 152 |
© Bayerisches Landesamt für Umwelt 2024