
- Startseite >
- Flüsse >
- Wasserstand >
- Bayern >
- Partenkirchen >
- Jahresgrafik

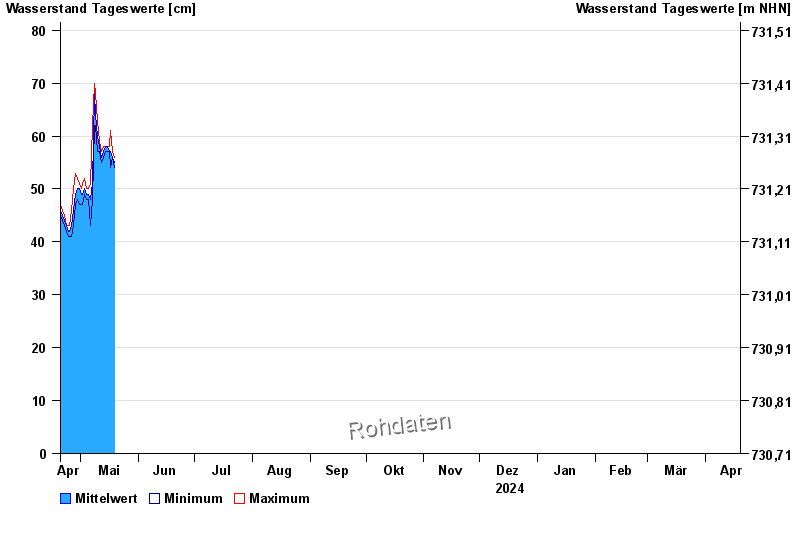
Jahresgrafik Partenkirchen / Partnach
Wasserstand vom 20.04.2024 bis zum 19.04.2025
Hinweis
Messwerte beeinflusst durch Kraftwerkssteuerungen.
| Datum | Mittelwert [cm] | Maximum [cm] | Minimum [cm] |
|---|---|---|---|
| 18.05.2024 | 57 | 57 | 56 |
| 17.05.2024 | 57 | 61 | 54 |
| 16.05.2024 | 57 | 58 | 57 |
| 15.05.2024 | 58 | 58 | 57 |
| 14.05.2024 | 58 | 58 | 57 |
| 13.05.2024 | 57 | 58 | 56 |
| 12.05.2024 | 56 | 57 | 55 |
© Bayerisches Landesamt für Umwelt 2024