
- Startseite >
- Flüsse >
- Wasserstand >
- Bayern >
- Partenkirchen >
- Jahresgrafik

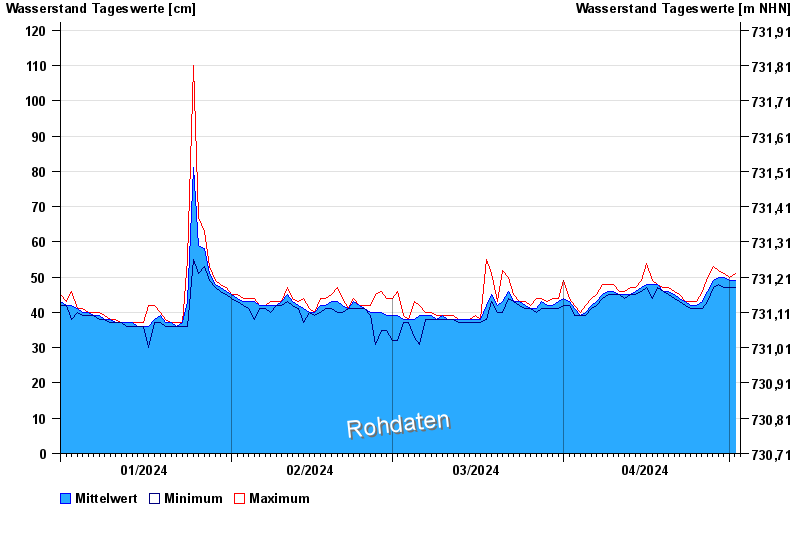
Jahresgrafik Partenkirchen / Partnach
Wasserstand vom 01.01.2024 bis zum 02.05.2024
Hinweis
Messwerte beeinflusst durch Kraftwerkssteuerungen.
- Wasserstand: cm
- Wasserstand: cm
- Wasserstand: cm
- Wasserstand: cm
- Wasserstand: cm
| Datum | Mittelwert [cm] | Maximum [cm] | Minimum [cm] |
|---|---|---|---|
| 02.05.2024 | 49 | 51 | 47 |
| 01.05.2024 | 49 | 50 | 47 |
| 30.04.2024 | 50 | 51 | 47 |
| 29.04.2024 | 50 | 52 | 48 |
| 28.04.2024 | 49 | 53 | 47 |
| 27.04.2024 | 46 | 50 | 43 |
| 26.04.2024 | 43 | 46 | 41 |
© Bayerisches Landesamt für Umwelt 2024