
- Startseite >
- Flüsse >
- Wasserstand >
- Bayern >
- Odelzhausen >
- Jahresgrafik

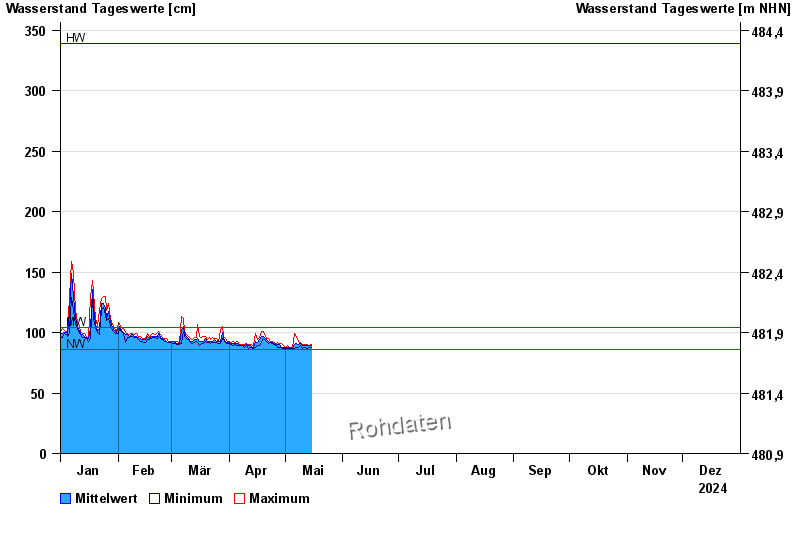
Jahresgrafik Odelzhausen / Glonn
Wasserstand vom 01.01.2024 bis zum 31.12.2024
| Datum | Mittelwert [cm] | Maximum [cm] | Minimum [cm] |
|---|---|---|---|
| 21.06.2024 | 98 | 103 | 97 |
| 20.06.2024 | 98 | 98 | 97 |
| 19.06.2024 | 99 | 100 | 98 |
| 18.06.2024 | 101 | 104 | 99 |
| 17.06.2024 | 100 | 103 | 99 |
| 16.06.2024 | 102 | 102 | 100 |
| 15.06.2024 | 103 | 104 | 102 |
© Bayerisches Landesamt für Umwelt 2024