
- Startseite >
- Flüsse >
- Wasserstand >
- Bayern >
- Oberndorf >
- Jahresgrafik

Jahresgrafik Oberndorf / Donau
Wasserstand vom 29.03.2024 bis zum 28.03.2025
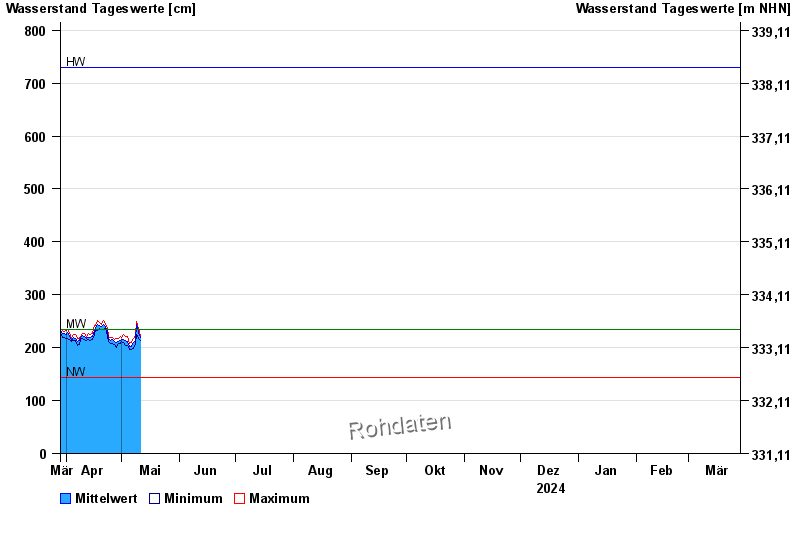
| Datum | Mittelwert [cm] | Maximum [cm] | Minimum [cm] |
|---|---|---|---|
| 28.04.2024 | 210 | 210 | 210 |
| 27.04.2024 | 211 | 215 | 206 |
| 26.04.2024 | 215 | 220 | 207 |
| 25.04.2024 | 214 | 219 | 207 |
| 24.04.2024 | 217 | 222 | 212 |
| 23.04.2024 | 231 | 239 | 221 |
| 22.04.2024 | 240 | 243 | 236 |
© Bayerisches Landesamt für Umwelt 2024