
- Startseite >
- Flüsse >
- Wasserstand >
- Bayern >
- Obernach >
- Jahresgrafik

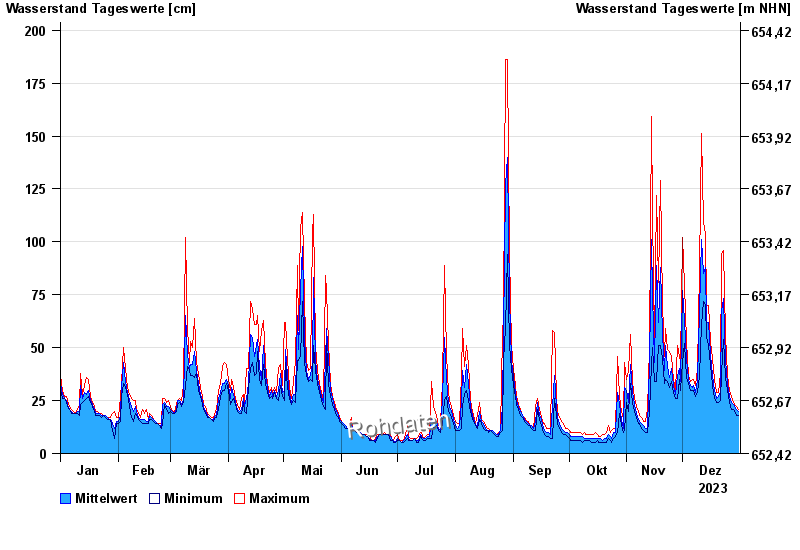
Jahresgrafik Obernach / Ach
Wasserstand vom 01.01.2023 bis zum 31.12.2023
- 22.05.1999 Wasserstand: 228 cm
- 20.02.1999 Wasserstand: 226 cm
- 31.07.1990 Wasserstand: 217 cm
- 04.08.2020 Wasserstand: 214 cm
- 23.08.2005 Wasserstand: 214 cm
| Datum | Mittelwert [cm] | Maximum [cm] | Minimum [cm] |
|---|---|---|---|
| 31.12.2023 | 20 | 21 | 18 |
| 30.12.2023 | 21 | 22 | 18 |
| 29.12.2023 | 22 | 23 | 20 |
| 28.12.2023 | 23 | 24 | 21 |
| 27.12.2023 | 24 | 27 | 21 |
| 26.12.2023 | 27 | 30 | 24 |
| 25.12.2023 | 33 | 37 | 30 |
© Bayerisches Landesamt für Umwelt 2024